April 2025 Monthly Market Update
May 6, 2025
April 2025 Market Summary: Domestic Stock Indices Mixed, Inflation Sets Record Low, Mid-Term Treasury Yields Fall
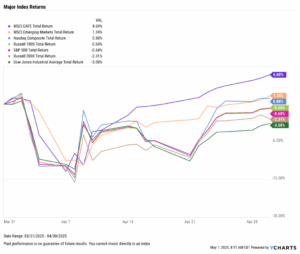
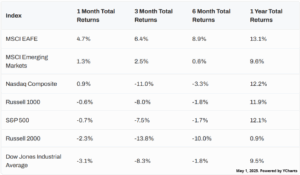
U.S. indices posted mixed results in April largely due to gains in the technology sector with tough quarters for some large-cap blue-chip companies. The Nasdaq Composite rose 0.88%, the S&P 500 slipped 0.68%, and the Dow Jones Industrial Average fell 3.08% due to significant losses by Chevron (-18.67%) and UnitedHealth Group (-21.44%), which make up 2% and 6% of the index, respectively.
Global markets had a positive month; Developed EAFE Markets posted a 4.69% gain and Emerging Markets added 1.34%.
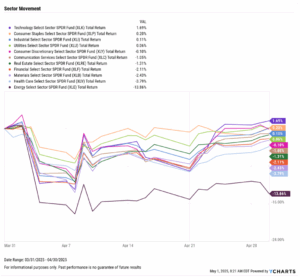
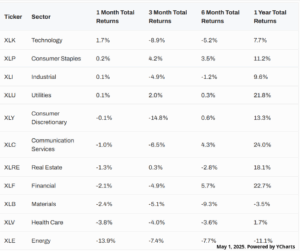
Seven of the eleven sectors were in the red in April. Oil prices tumbled in April, forcing the Energy sector down 13.86%. The second worst performer was the Health Care sector, which fell 3.8% in part due to shares of UnitedHealth Group (the second largest company in the sector) plummeting after missed earnings and a cut to its full-year profit forecast, cutting 35% off its peak market cap of $575 billion in November 2024. Technology was the best performer with a 1.69% gain, followed by Consumer Staples, which added 0.2%.
Inflation fell to the lowest YoY level since February 2021, and Core Inflation came in under 3% for the first time in over four years. Oil prices tumbled in April; Brent crude oil fell 14.4% to $66.13 per barrel as of April 28th, while the price of WTI per barrel sank to $63.30. The Median Sales Price of Existing Homes rose back to its December 2024 level of $403,700 in March, the latest data available.
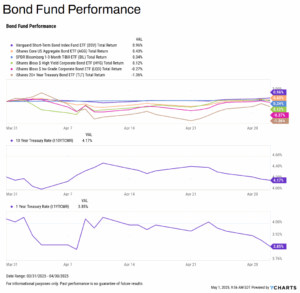
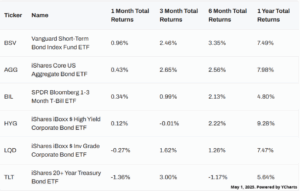
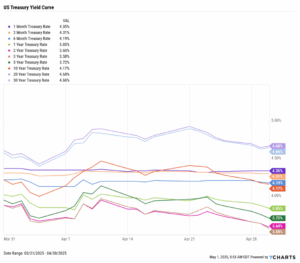
Mid-term treasury yields with durations between 1 and 10 years declined in April while the long term 20-year and 30-year both rose slightly. This treasury yield movement led the iShares Core US Aggregate Bond ETF (AGG) to increase 0.43% while the iShares 20+ Year Treasury Bond ETF (TLT) declined 1.36%.
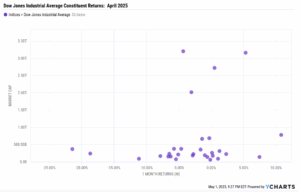
Chappell Wealth Watch! Winners & Losers of the Dow Jones
While the tech-heavy Nasdaq gained 0.88% in April, the Dow Jones Industrial Average consisting of 30 “blue-chip” names shed 3.08%. 21 of the 30 Dow constituents were negative in April, including these five worst performers:
- UnitedHealth Group (UNH): -21.44%
- Chevron (CVX): -18.67%
- Nike (NKE): -11.15%
- The Walt Disney Co (DIS): -7.85%
- Amgen (AMGN): -6.62%
Here were the five best Dow performers in April:
- Walmart (WMT): 10.78%
- Boeing (BA): 7.44%
- Microsoft (MSFT): 5.29%
- McDonald’s (MCD): 2.33%
- Coca-Cola (KO): 1.30%
Equity Performance: Developed Global Markets Push Higher, Nasdaq Rises While Blue-Chip Dow Jones Index Falls
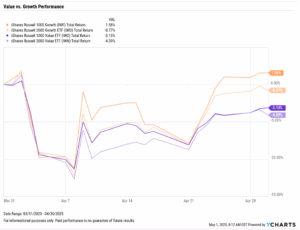
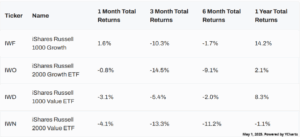
Value vs. Growth Performance
US Sector Movement
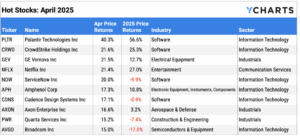
Top 10 S&P 500 Performers of April 2025
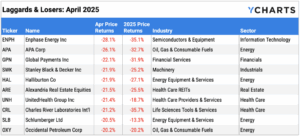
10 Worst S&P 500 Performers of April 2025
Economic Data Overview: Inflation Reaches Lowest YoY Level in Over Four Years, Oil Prices Tank, Home Prices Rise
Employment
The unemployment rate ticked higher for the second straight month, with March’s figure coming in at 4.2%. The labor force participation rate hovered at 62.5%. Nonfarm payroll data for March revealed that the U.S. economy added 228,000 jobs in the month, surpassing the 140,000 estimate.
Consumers and Inflation
The US inflation rate dropped further to 2.39% in March, reaching its lowest level since February 2021. Core inflation’s print of 2.79% also hit a milestone as it fell below 3% for the first time since April 2021. The US Consumer Price Index contracted by 0.1%, doing so for the first time since May 2020, and US Personal Spending rose 0.66%.
The Federal Reserve maintained its key Fed Funds Rate target range of 4.25%-4.50% at the FOMC’s March 19th meeting. The next meeting will take place May 7th, where investors anticipate the Fed Funds Rate to remain unchanged for the third consecutive meeting, according to the CME FedWatch tool.
Production and Sales
The US ISM Manufacturing PMI fell by 0.3 points in April to 48.7, keeping the index in contraction territory. The Services PMI declined by 2.7 points between February and March, bringing its latest reading down to 50.80. The YoY US Producer Price Index declined to 2.74% in March, while US Retail and Food Services Sales jumped 1.43% MoM between February and March.
Housing
US New Single-Family Home Sales spiked 7.42% higher MoM in March, though Existing Home Sales contracted by 5.85% MoM. The Median Sales Price of Existing Homes grew to $403,700 in March, the same level as December 2024, and remains 5.43% off its all-time high. Mortgage rates were relatively stable in April; the 15-year Mortgage Rate was 5.94% as of April 24th, while the 30-year settled at 6.81%.
Commodities
The price of gold reached another all-time high in April, touching $3,500 per ounce in US Dollars before ending the month at $3,288.16. Oil prices took a dive in April; Brent crude oil plummeted 14.4% MoM to $66.13 per barrel as of April 28th, while the price of WTI slipped 11.9% to $63.30 per barrel as of the same date. The average price of gas declined two cents MoM to $3.26 per gallon.
Fixed Income Performance: Insights into Bond ETFs & Treasury Yields
US Treasury Yield Curve
Bond Fund Performance