April 2026 Monthly Market Update
May 8, 2026
Market Summary: Yields Rise as the Nasdaq Leads All Indices, Technology Stands Out As Winner
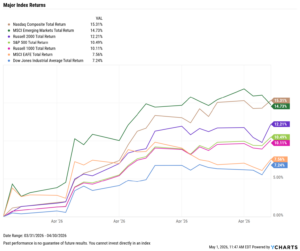
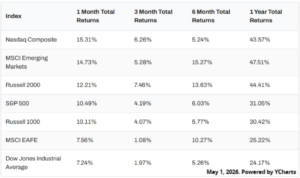
Markets rose sharply in April, with the S&P 500 rising by 10.4% and posting its best month since November 2020. The Nasdaq led the way, up 15.3% as a total of five major indices posted returns of more than 10%.
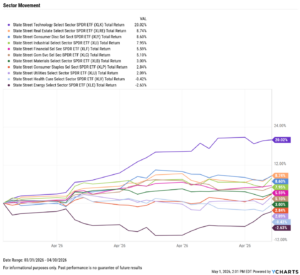
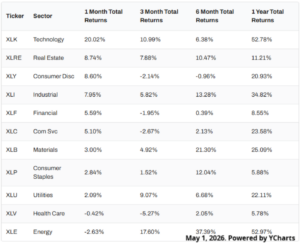
Sector performance experienced similar successes, though results were not uniform. Technology led by a wide margin, up more than 20%, followed by Real Estate in second, up 8.7%. Energy, which spiked by 10% in March, lagged in April, down 2.6% as work towards a resolution with Iran hangs in the balance.
The Federal Reserve’s next meeting is scheduled for June 17th, though expectations for any rate cut remain muted at less than 5%. Nonfarm payrolls grew by an unexpected 178,000 jobs in the same period which the unemployment rate dropped by 0.1 percentage points to 4.3%.
The Median Sales Price of Existing Homes increased to $408,800, as the US inflation rate increased by 0.90% MoM to 3.3%, its largest monthly jump since April 2021. Core inflation experienced a more modest increase of 0.10% to 2.60%.
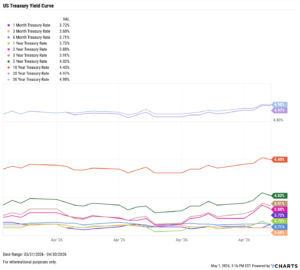
Treasury yields rose slightly in April, apart from the short end of the curve. The 3-, 5-, 10-, and 30-year all ticked up by exactly 10 basis points for the month, while the 6-month fell by a single basis point.
Chappell Wealth Watch! Best Month Since November 2020
The S&P 500 advanced by 10.4% in April, marking its best month since November 2020, after what was an uncomfortable first quarter of the year. The market entered the final day of Q1 down by more than 7%, and with investor sentiment at its lowest, one of the strongest runs in recent history was kick-started.
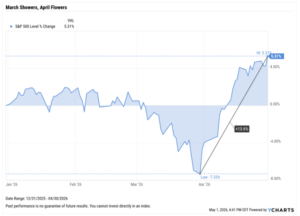
March 31st began a run of seven consecutive positive closes on the S&P 500, effectively regaining the losses from the entire prior quarter, and setting the momentum that carried throughout April.
During the 21 trading days in April, the S&P was positive 15 times (71.4%), and never fell by more than 0.5% in a single day. The technology sector was the greatest beneficiary of this run, advancing by more than 20% alone, while the energy sector pulled back by nearly 3%.
The distance between March’s lows and April’s record highs was measured in weeks, an increasingly common result for markets where sentiment is driven by algorithms and instant access to information.
For clients, this is a reminder that the cost of reacting to uncertainty has consistently outweighed the discomfort of enduring it.
Equity Performance: All Major Indices Positive, Technology Surges 20% as Energy Falls Negative
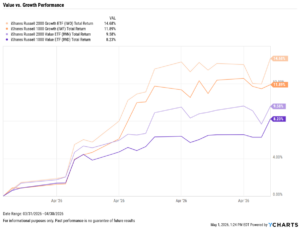
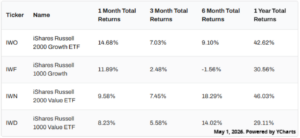
Value vs. Growth Performance
US Sector Movement
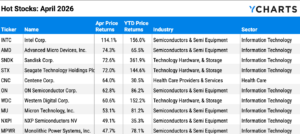
Top 10 S&P 500 Performers of April 2026
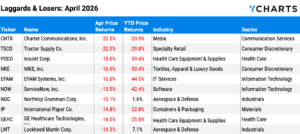
10 Worst S&P 500 Performers of April 2026
Economic Data Overview: Strong Job Additions, Inflation Worries as Oil Remains the Key
Employment
The unemployment rate fell by 0.1 percentage points to 4.3%, and the U.S. economy added 178,000 jobs according to the most recent nonfarm payrolls report, well above the Dow Jones estimate of 59,000. The US Labor Force Participation Rate decreased by 0.1 percentage points for the second straight month to 61.90%.
Consumers and Inflation
The US inflation rate increased by 0.90% MoM to 3.3%, the largest monthly jump since April 2021. Core inflation experienced a more modest increase of 0.10% to 2.60%. The CME FedWatch tool indicates less than a 5% of the first rate cut in 2026 during the FOMC’s next meeting on June 17th. Rates were held steady at 3.50-3.75% in April, during Jerome Powell’s final FOMC meeting as Fed Chair.
Production and Sales
The US ISM Manufacturing PMI went unchanged, sitting at 52.7 for the second consecutive month. The Services PMI fell by 2.1 points, though still sitting well above the expansion threshold. The YoY US Producer Price Index rose for a third month straight to 4.00%, while the US Retail and Food Services Sales also increased month-over-month.
Housing
Existing Home Sales dropped MoM by 3.63%, a fourth straight month of moves of 2.5% or greater in either direction. The Median Sales Price of Existing Homes increased by roughly $10,000 to $408,800, after two months of prices below $400,000.
Mortgage rates fell in April, ending the month at 5.64% for the 15-year and 6.30% for the 30-year. US New Single-Family Home Sales experienced its worst MoM decline in nearly 13 years, falling 17.56% in January.
Commodities
Gold fell 1% in April, leaving the SPDR Gold Shares ETF (GLD) trading at $423.66 per share. Silver was hit slightly harder, down 2.1% to end the month.
Oil prices remained the standout story in April due to the conflict in Iran. Geopolitical tensions in the Middle East have strained oil supply, pushing Brent crude to $113.89 and WTI to $99.89 per barrel. Consumers are feeling this at the pump, with the US Retail Gas Price holding above $4 per gallon for the entire month of April.
Fixed Income Performance: Insights into Bond ETFs & Treasury Yields
US Treasury Yield Curve
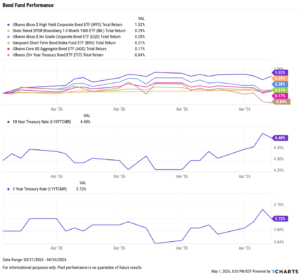
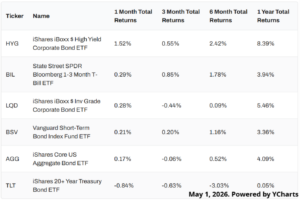
Bond Fund Performance