February 2025 Monthly Market Update
March 7, 2025
February 2025 Market Summary: U.S. Stock Indices Post Modest Declines, Employment Situation Improves, and the Median Home Price Slides Further
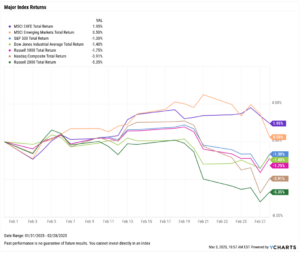
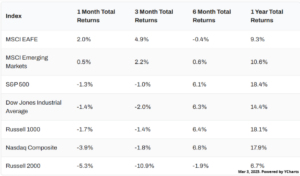
Domestic stock indices turned negative in February as ex-U.S. indices posted positive performances. The S&P 500 fell 1.3%, the Dow Jones Industrial Average slipped 1.4%, and the Nasdaq Composite tumbled 3.9%. Emerging Markets added 0.5%, and Developed EAFE Markets logged a 2% gain.
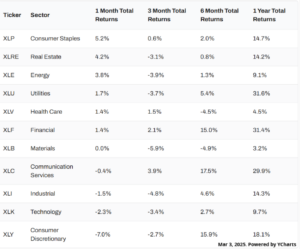
The two consumer-related sectors were at the highest and lowest ends of the returns spectrum in February. Consumer Staples rose 5.2% in February, and Consumer Discretionary fell 7%. Six of the 11 total sectors were positive in February.
The Median Sale Price of Existing Homes fell below $400,000 for the first month in nearly a year, as New Single-Family Home Sales plummeted 10.5% MoM in December. On the employment front, unemployment fell to 4.0% as labor force participation rose. In commodity news, Gold reached a new all-time high in February as oil prices slipped.
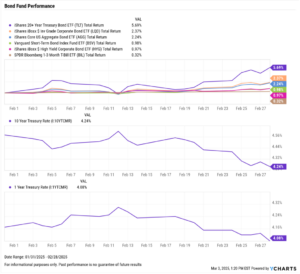
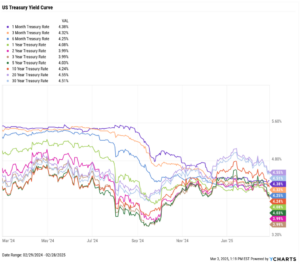
Yields on mid to long-term Treasury instruments fell in February while shorter-term yields remained largely unchanged month over month. The decline in longer-term yields helped push bond funds higher, including the iShares 20+ Year Treasury Bond ETF (TLT), which advanced 5.7% in February.
Off the YCharts! The Not-so-Magnificent Seven
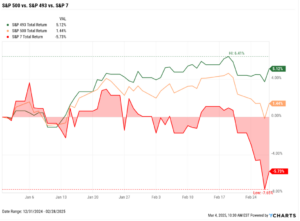
The Magnificent Seven stocks––Apple (AAPL), Amazon (AMZN), Alphabet (GOOG, GOOGL), Meta Platforms (META), Microsoft (MSFT), NVIDIA (NVDA), and Tesla (TSLA)–lifted the market higher in 2023 and 2024, combining for a 156.1% return over that two-year span compared to a 25.2% gain for the rest of the index. (The S&P 500 overall was up 53.2% between 2023-2024.)
However, the tables seem to be turning in 2025.
Though the S&P 500 is up 1.4% through the first two months in 2025, it’s the broader “S&P 493” that is keeping the overall index afloat as the Magnificent Seven finds itself in selloff mode. This chart highlights a potential shift in market leadership and a market rotation into the broader S&P 493 companies that have performed well while the largest tech stocks have struggled.
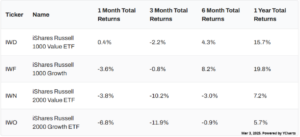
Equity Performance: U.S. Stocks Slide in February, ex-U.S. Indices Rise
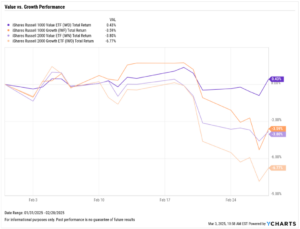
Value vs. Growth Performance
US Sector Movement

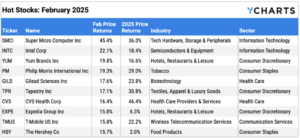
Hot Stocks: Top 10 S&P 500 Performers of February 2025
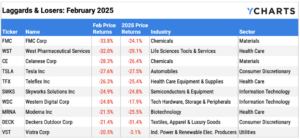
Laggards & Losers: 10 Worst S&P 500 Performers of February 2025
Economic Data Overview: Home Prices Fall along with Sales Activity, Cryptocurrency Prices Plummet
Employment
The unemployment rate fell to 4.0% for the first time since May 2024, while the labor force participation rate inched higher by one-tenth of a percentage point to 62.6%. Nonfarm payroll data showed that the U.S. economy added 143,000 jobs in January, falling short of the expected 175,000 figure.
Consumers and Inflation
The US inflation rate rose to 3.00% in January, reaching this level for the first time since May 2024. Core inflation stayed roughly the same, clocking in at 3.26%. The US Consumer Price Index rose 0.47% month over month, and US Personal Spending contracted for the first time since March 2023.
The Federal Reserve maintained its key Fed Funds Rate target range of 4.25%-4.50% at the FOMC’s January 29th meeting. The next meeting will take place March 18-19th, where investors anticipate the Fed Funds Rate to remain unchanged, according to the CME FedWatch tool.
Production and Sales
The US ISM Manufacturing PMI fell by 0.6 points in February but remained in expansion territory at 50.30. The Services PMI declined 1.2 points between December and January, bringing its latest reading down to 52.80. The YoY US Producer Price Index rose to 3.51% in January, while US Retail and Food Services Sales MoM contracted -0.88% between December and January.
Housing
US New Single-Family Home Sales plummeted 10.5% MoM in December, and Existing Home Sales also slipped 4.9% MoM. The Median Sales Price of Existing Homes fell for the sixth time in the last seven months to $396,900, falling below $400,000 for the first time since March 2024. Mortgage rates came down slightly as well; the 15-year Mortgage Rate ended up at 5.94% in the last week of February, while the 30-year settled at 6.76%.
Commodities
The price of gold surged as much as 4.4% in February but ended the month 0.8% higher MoM, finishing February at $2,834.60 per ounce in US Dollars. Oil prices moved in the opposite direction; Brent crude oil fell 2.9% in February to $74.89 per barrel as of February 24th, while the price of WTI slipped 2.4% to $71.06 per barrel as of February 24th. The average price of gas increased 3 cents MoM to $3.25 per gallon.
Fixed Income Performance: Insights into Bond ETFs & Treasury Yields
US Treasury Yield Curve
Bond Fund Performance