February 2026 Monthly Market Update
March 13, 2026
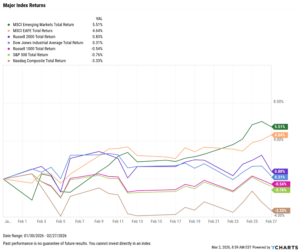
Market Summary: Software and Growth Stocks Tumble, Internationals Continue to Push Higher
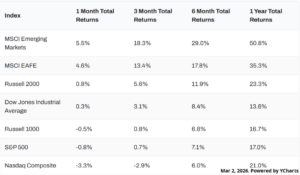
Markets posted a mixed February, as international equities finished in first once again. Emerging markets led the way, up 5.5% for the month, as the S&P 500 fell 0.8%. The Nasdaq posted the worst month of all indices for the second consecutive month, falling 3.3%.
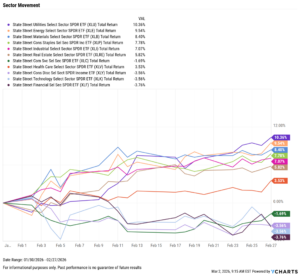
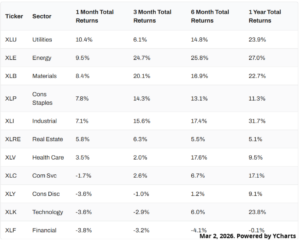
Sector performance diverged, with Utilities soaring 10.4% and Energy advancing 9.5%. Four sectors finished negative, with Financials lagging hardest for the second straight month, down 3.8%.
The Federal Reserve’s next meeting is scheduled for March 18, though expectations for any rate cut remain muted at 2%. Nonfarm payrolls greatly exceeded expectations by 75,000 jobs in January, as the unemployment rate fell by 0.1 percentage points to 4.3%.
Housing prices continued to fall, but existing home sales activity experienced its sharpest decline since the COVID-19 lockdown, down 8.43% MoM. Inflation continues moving closer to the 2% target, down to 2.40% in January.
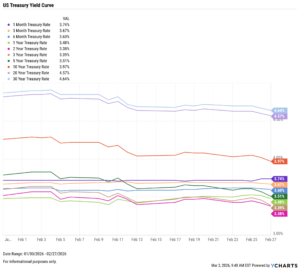
Treasury yields fell sharply in February, with the 1-month the only one to increase, up just 2 basis points to 3.74%. The 10-year saw the sharpest decline, down 29 bps to 3.97%, while the 3-, 5-, 20-, and 30-year all dropped by more than 20 bps.
Chappell Wealth Watch! Software Industry Suffers
February revealed a growing divergence beneath the surface of the market. While the S&P 500 remained relatively steady, software stocks sold off sharply, highlighting renewed pressure across the SaaS landscape.
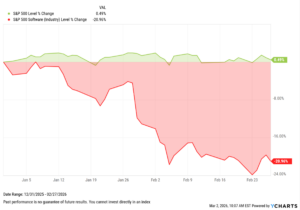
AI’s expanding influence has increased investor scrutiny around software companies’ long-term defensibility. Investors are increasingly evaluating which platforms can integrate AI effectively and which may face margin compression or displacement risk.
This was not a collapse in fundamentals, but a reset in expectations. Revenues and earnings generally held up across the industry. However, valuations had been priced for near-perfect execution, and even modest guidance adjustments accelerated this repricing.
For advisors, the divergence helps illustrate how quickly leadership can shift when sentiment turns. February reinforced an important reminder that index stability can mask meaningful internal rotation, and thoughtful positioning will continue to matter in 2026.
Equity Performance: International Markets Continue to Lead, Utilities Surge as Growth and Technology Fall
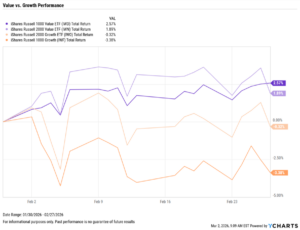
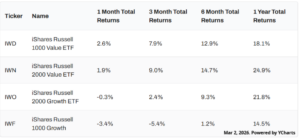
Value vs. Growth Performance
US Sector Movement
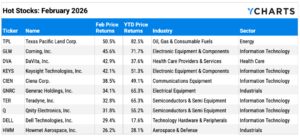
Top 10 S&P 500 Performers of February 2026
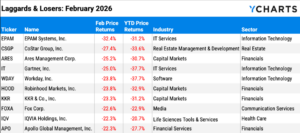
10 Worst S&P 500 Performers of February 2026
Economic Data Overview: Inflation and Labor Conditions Improve, Housing Activity Falls Sharply
Employment
The unemployment rate decreased by 0.1 percentage points to 4.3%, and 130,000 jobs were added to the U.S. economy, according to the most recent nonfarm payrolls report. This came in well above the Dow Jones estimate of 55,000. The US Labor Force Participation Rate also increased by 0.1 percentage points to 62.50% in January.
Consumers and Inflation
The US inflation rate fell to 2.40% in January, approaching the Fed’s 2% target, though core inflation rose to 3.09%. The CME FedWatch tool indicates less than a 3% chance of the first rate cut in 2026 during the FOMC’s next meeting on March 18th. Rates were held steady at 3.50-3.75% in January, the first pause in cuts since September.
Production and Sales
The US ISM Manufacturing PMI increased MoM for the first time since September, up to 52.6, into expansion territory for the first time since February of 2025. The Services PMI remained unchanged in January at 53.8. The YoY US Producer Price Index sits at 2.88% in January, while the US Retail and Food Services Sales fell by 0.02% on the month.
Housing
Existing Home Sales fell sharply by 8.43% MoM in January, the largest monthly decline since April of 2020. The Median Sales Price of Existing Homes decreased to $396,800, the first reading below $400,000 in 11 months.
Mortgage rates were largely unchanged in January, ending the month at 5.44% for the 15-year and 5.98% for the 30-year. The US New Single-Family Home Sales fell by 1.72% in December, following growth of 15.55% in November.
Commodities
Gold posted another great month, increasing by 7.93%, leaving SPDR Gold Shares ETF (GLD) trading at $483.75 per share. Silver had a volatile February, though it ultimately advanced another 12.66% on the month.
Oil prices moved slightly as geopolitical tensions continued to raise concerns. Brent crude fell by 0.48% for the month to $71.90 per barrel, as WTI increased by 2.88% to $66.36.
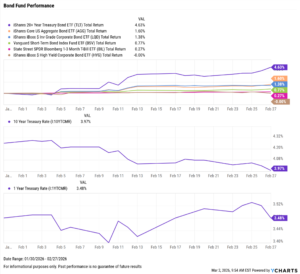
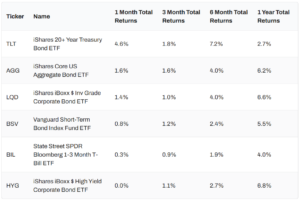
Fixed Income Performance: Insights into Bond ETFs & Treasury Yields
US Treasury Yield Curve
Bond Fund Performance