June 2026 Monthly Market Update
July 10, 2026
Market Summary: June Sees Mixed Index and Sector Performance as Commodity Prices Tumble
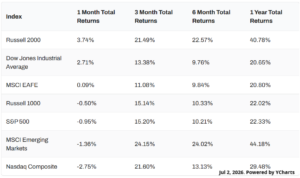
Markets were mixed in June. The small caps Russell 2000 led the way with a 3.7% gain, while the blue-chip Dow Jones Industrial Average posted a 2.7% increase. The tech-heavy Nasdaq was the largest laggard, slipping 2.8% in June.
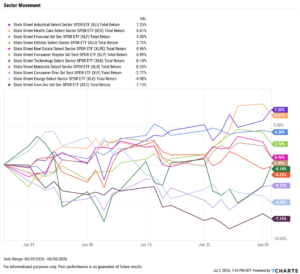
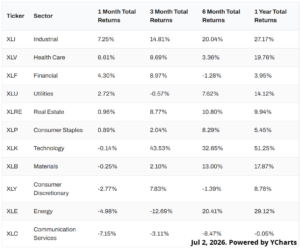
Sector performance was split fairly evenly, with six of the eleven sectors ending the month higher. Industrials led with a 7.3% gain, followed by Health Care rising 6.6%. Energy lagged for the third consecutive month, down 5.0%, with Communication Services logging the worst sector performance of 7.2% in June.
Commodity prices plummeted in June. The price of Gold slumped 11.7% in June, and 14.4% in Q2. The price of Silver fell even harder, down 21.8% in the month and 21.5% for the quarter. Oil price volatility continued in June, as the price of Brent crude tumbled 22.9% in the month, putting it 48% below its high set in early April. WTI ended June down 21.2%, and 37.3% below its recent high set three months ago.
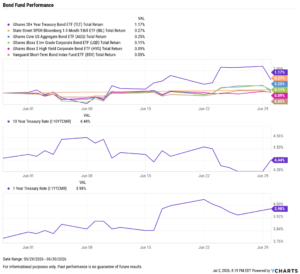
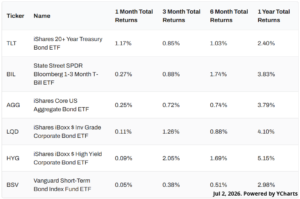
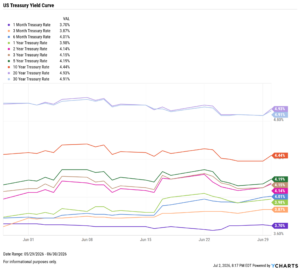
Treasury yields had mixed movements in June as yields on shorter-term treasuries increased while those of longer-term instruments decreased. The 3-month, 6-month, and 1-year rose 18, 23, and 19 basis points, respectively. The 20-year declined 5 basis points, and the 30-year slipped 8 bps. Bond funds were up across the board in June, as the iShares 20+ Year Treasury Bond ETF (TLT) led with a 1.2% gain.
Chappell Wealth Watch! Halftime Report
Six months into 2026, market leadership has broadened well beyond large-cap US equities for the second consecutive year.
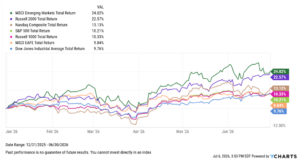
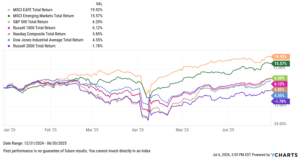
Emerging markets and small caps have led the way, up 24% and 22.6% respectively, both well ahead of the S&P 500’s 10.2% gain. At this point last year, the S&P had only increased by 6.2%, and would ultimately finish the year nearly 18% higher. All other major indices are positive by more than 9%.
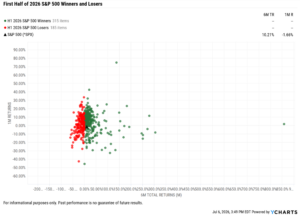
Breadth beneath the S&P 500 supports the broader participation story. Of the index’s 500 constituents, 315 posted positive six-month total returns against 185 decliners, with gains led by Sandisk, up more than 850%.
Inflation remains the backdrop to watch. In May, the US inflation rate rose 0.40% month over month to 4.2%, the highest reading in three years and the third straight monthly increase. The Fed has now run above its 2% target for more than 5 years, and core PCE, which excludes food and energy prices, last fell below that threshold in February 2021.
For advisors, the H1 data points to a market rewarding a wider set of exposures than just large-cap US equities, with a persistently elevated inflation picture worth watching as we head into the back half of the year.
Equity Performance: Small Caps Lead as Tech-Heavy Nasdaq Lags, Industrials and Health Care Outperform while Energy and Communication Services Struggle
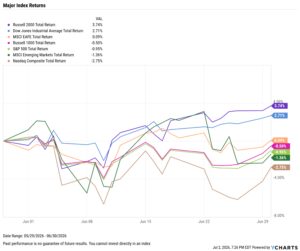
Value vs. Growth Performance
US Sector Movement
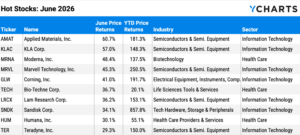
Top 10 S&P 500 Performers of June 2026
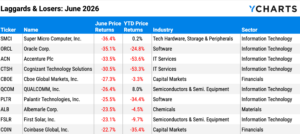
10 Worst S&P 500 Performers of June 2026
Economic Data Overview: Inflation Reaches 3-Year High as Commodity Prices Plummet
Employment
The unemployment rate ticked down 0.1 percentage point to 4.2%, the lowest level in one year, and the U.S. economy added 57,000 jobs according to the most recent nonfarm payrolls report, well below the Dow Jones consensus forecast of 115,000. The US Labor Force Participation Rate decreased by 0.3 percentage points to 61.80%, reaching a five-year low.
Consumers and Inflation
The US inflation rate rose another 0.40% MoM to 4.2%, the highest reading since May 2023 and third straight monthly increase. Core inflation increased by 0.10% MoM to 2.90%, also logging its third monthly increase. The CME FedWatch tool indicates an 82% chance that the FOMC will hold the Fed Funds Rate at 3.50–3.75% during its next meeting on July 29th, with market pricing increasingly reflecting the possibility of a hike later in 2026.
Production and Sales
The US ISM Manufacturing PMI declined by 0.7 points to 53.30 for June after setting a three-year high of 54.00 in May. The Services PMI rose by 0.9 points in May to 54.50. The YoY US Producer Price Index surged higher for a fifth straight month straight to 6.5% in May, its highest reading since December 2022, while US Retail and Food Services Sales continued to increase, at 0.88% in May.
Housing
Existing Home Sales increased 3.22% MoM in May, while the Median Sales Price of Existing Homes reached a new all time high of $429,300, an increase of 2.83%, or $11,800, MoM.
Mortgage rates went virtually unchanged in June, ending the month at 5.84% for the 15-year and 6.49% for the 30-year, both as of June 25th. US New Single-Family Home Sales declined MoM, falling 7.35% in May, though well off the pace of January’s historic 20% drop.
Commodities
The price of Gold tumbled in June, with SPDR Gold Shares (GLD) plummeting 11.7% to end the month at $368.38 per share. Gold fell 14.4% in Q2. Silver fared even worse in June, as the iShares Silver Trust (SLV) tumbled 21.8% in the month and 21.5% for Q2.
Oil prices remained top of mind in June, though a fragile ceasefire framework between the US and Iran eased a significant amount of pressure on prices. Brent crude finished the month at $71.59, down 22.9% in June and 48% below the high of $138.21 set in early April. WTI ended June down 21.2% at $71.87 per barrel, 37.3% below the recent high of $114.58 it also reached in early April. The lower oil prices helped motorists feel relief at the pump, with the US Retail Gas Price falling 48 cents since the start of the month rising to $3.96 per gallon in June.
Fixed Income Performance: Insights into Bond ETFs & Treasury Yields
US Treasury Yield Curve
Bond Fund Performance