May 2024 Monthly Market Update
June 6, 2024
May 2024 Market Summary: Equities Bounce Back, Sticky Inflation and Lower Long-Term Treasury Yields
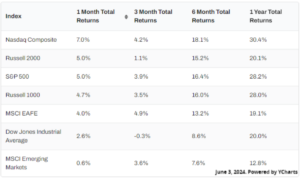
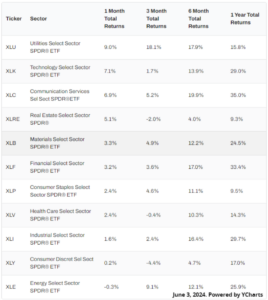
Equities returned to winning ways in May following a down April that had stunted three straight months of gains in 2024. The Dow Jones Industrial Average rose 2.6% in May, the S&P 500 advanced 5%, and the NASDAQ surged 7%. EAFE gained 4% in May, while Small Caps bested Large Caps by three-tenths of a percentage point. Utilities was the best-performing sector for the second straight month, jumping 9% in May. Technology and Communication Services followed with respective gains of 7.1% and 7%. The only negative sector in May was Energy, which slipped 0.3%.
Both new single-family home sales and existing home sales slumped in May; at the same time, the median existing home sales price advanced above $400,000. Inflation remained in the mid-three percent range for the tenth straight month, while US PPI increased to 2.17%. The unemployment rate increased to 3.9%, and April’s job gains were the lowest in seven months.
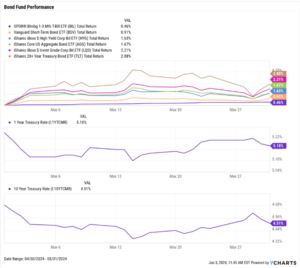
Yields on mid- to long-term Treasury bonds declined in May while T-Bill instruments saw minimal movement. For the second straight month, the 5-year Treasury note saw the largest movement of any duration on the curve, down 20 basis points. The 2-year, 3-year, 10-year, 20-year, and 30-year all decreased by double-digit basis points, while yields on the 1-month and 3-month T-Bills were unchanged.
Bond funds saw some gains on the back of lower yields. The iShares 20+ Year Treasury Bond ETF (TLT) advanced 2.9%, the largest increase of any bond fund tracked on our chart (below).
Chappell Wealth Watch! Sell in May and Go Away?
The old stock market adage of “Sell in May and Go Away” refers to an investing strategy that suggests pulling investments out of the market in May in order to miss the seasonally weaker stock market performance that occurs between May and October.
But to what extent is this adage actually true? And is being uninvested during this period beneficial or harmful over the long-term? We looked at the data behind “Sell in May and Go Away” to find out.
Below is a table showing average S&P 500 returns each month since 1950:
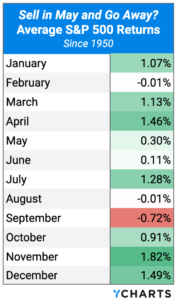
While it is true that most months between May and October have historically delivered lower stock market returns versus those between November and April, selling in May and moving to cash for six months each year produced significantly lower annualized returns over the long run as a result of less time in the market.

Equity Performance: Stocks Rebound Across the Board
Major Indexes

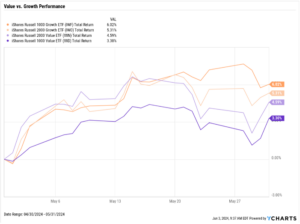
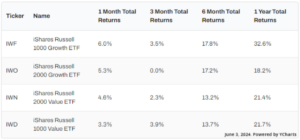
Value vs. Growth Performance
US Sector Movement

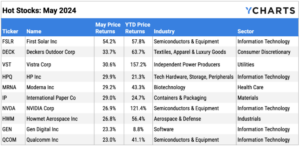
Top 10 S&P 500 Performers of May 2024
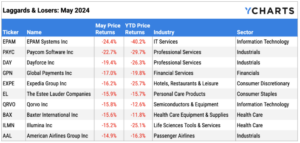
10 Worst S&P 500 Performers of May 2024
Economic Data Overview: Inflation Persists, Home Sales Decline While Values Rise
Employment
April’s unemployment rate inched up to 3.9% while the labor force participation rate remained unchanged at 62.7%. Nonfarm payroll data showed 175,000 new jobs were added in April, the lowest level of job gains since October 2023 and below the expected value of 243,000 for the month.
Consumers and Inflation
April’s US inflation figure came in at 3.36%, marking the tenth consecutive month that YoY inflation has hovered in the 3 to 4 percent range. Core Inflation dropped to 3.61%, the lowest YoY rate since May 2021. The monthly US Consumer Price Index rose 0.31% in April, and US Personal Spending posted a small monthly increase of 0.20%. No changes have been made to the Fed Funds Rate of 5.50% since the most recent FOMC meeting on May 1st, 2024.
Production and Sales
After posting an expansion reading in March for the first time since October 2022, the US ISM Manufacturing PMI slipped another 0.5 points further into contraction territory in May to 48.70. The YoY US Producer Price Index for April came in at 2.17%, the first time above 2% since April 2023 and third consecutive monthly increase, while April US Retail and Food Services Sales were unchanged MoM.
Housing
US New Single-Family Home Sales fell 4.7% in April, while US Existing Home Sales slipped 1.9% MoM. Despite the reduced housing demand, the Median Sales Price of Existing Homes increased 3.7% in April to $407,600. Mortgage rates fell slightly in May; as of May 30th, the 15-year Mortgage Rate lowered to 6.36% and the 30-year came in just above 7% at 7.03%.
Commodities
The price of Gold rose slightly in May to $2,348.30 per ounce as of May 31st following several surges in 2024. Crude oil prices fell MoM; as of May 28th, the price of WTI slipped 3.1% to $80.90 per barrel while Brent recorded a 7.8% downturn to clock in at $81.34 per barrel. As a result, the average price of gas fell 8 cents to $3.70 per gallon.
Fixed Income Performance: Insights into Bond ETFs and Treasury Yields
US Treasury Yield Curve

Bond Fund Performance