November 2023 Monthly Market Update
December 7, 2023
November 2023 Market Update
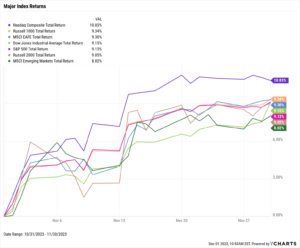
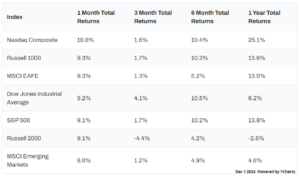
Stocks recorded a highly bullish November as the S&P 500 advanced 9.1%, the Dow Jones Industrial Average charged 9.2% higher, and the NASDAQ surged 10.8%. The Russell 1000 finished November up 9.3%, and the small-cap Russell 2000 added 9.1%. Global indices joined the party as well–Emerging Markets posted an 8.0% gain in November and EAFE jumped 9.3%.
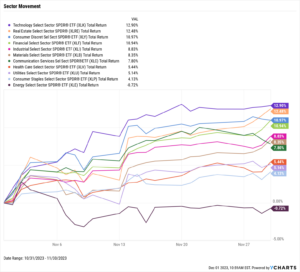
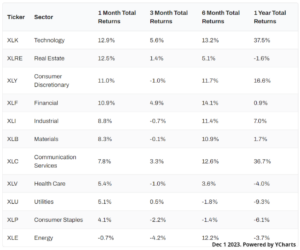
Energy was the month’s sole negative sector, declining 0.7%. The Technology, Real Estate, Consumer Discretionary, and Financial sectors all posted double-digit gains in November.
Existing home sales declined for the fifth straight month while the median price of an existing home fell for the fourth month in a row. However, the 15-year Mortgage Rate backed off of 7%, a level it hadn’t reached since 2000. Both inflation and core inflation decelerated, and CPI was nearly unchanged MoM. The per-ounce price of Gold breached the key $2,000 level in November and is 1.5% off from its all-time high of $2,067.20.
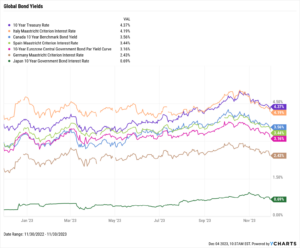
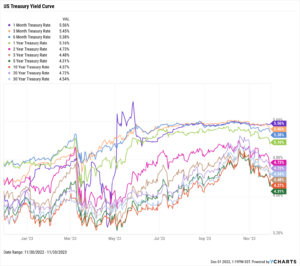
Treasury yields tumbled in November as investors piled back into equities. Yields on the 5-year and 10-year treasuries fell by 51 basis points, the most out of any duration on the curve. The 1-month T-Bill ended November unchanged at 5.56%. Yields on certain global fixed-income instruments also dove lower in November.
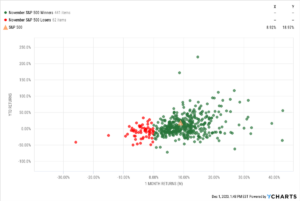
Chappell Wealth Watch! November S&P 500 Winners & Losers
Out of the 503 S&P 500 constituents, 441 of them posted positive returns in November. In other words, 87.7% of the S&P 500 had a positive month.
However, finding an individual stock that outperformed the S&P 500 index’s 8.92% gain in November was a more difficult task. 250 of the 503 constituents posted a return higher than the S&P 500 index’s November gain, giving just about a 50-50 chance of picking a company that would’ve beaten the index.
Equity Performance
Major Indexes
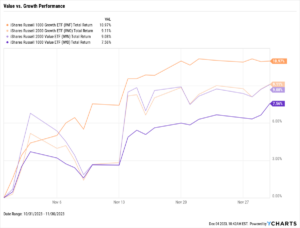
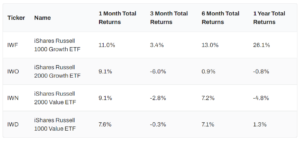
Value vs. Growth Performance
Trailing Twelve Months
US Sector Movement
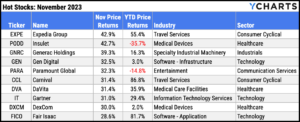
Top 10 S&P 500 Performers
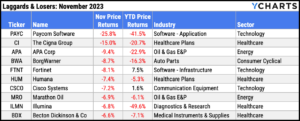
10 Worst S&P 500 Performers
Economic Data
Employment
October’s unemployment rate increased one-tenth of a percentage point to 3.9%, while the labor force participation rate decreased by that same amount to 62.7%. October nonfarm payroll data showed 150,000 jobs added, falling short of the 170,000 expected for the month.
Consumers and Inflation
The US inflation rate decreased to 3.24% in October, down from 3.70% in September. Core Inflation decelerated for the seventh consecutive month, from 4.15% in September to 4.03% in October. The US Consumer Price Index was essentially unchanged MoM, and US Personal Spending grew at a below-average rate of 0.22% MoM.
Production and Sales
The US ISM Manufacturing PMI remained unchanged at 46.7 in November and in contraction territory for the 13th consecutive month. October US Retail and Food Services Sales contracted by 0.1% MoM, while the YoY US Producer Price Index fell eight-tenths of a percentage point in October to 1.34%.
Housing
US New Single-Family Home Sales MoM continued its up-and-down ways in October, contracting by 5.6% after having jumped 8.6% in September. US Existing Home Sales sank 4%, down for the fifth consecutive month and 19th out of the last 21. The Median Sales Price of Existing Homes fell for the fourth straight month, to $391,800 in October. Mortgage rates cooled down in November; the 15-year Mortgage Rate closed out the month at 6.56% after topping 7% for the first time since December 2000, and the 30-year ended November at 7.22%, down 0.79 percentage points since the end of last month.
Commodities
The price of Gold crossed above $2,000 in November to $2,035.50 per ounce as of November 30th. Crude oil went the opposite direction; the price of WTI oil fell 8.8% in November to $74.46 per barrel as of November 27th, while Brent slipped 8.4% to $79.49 per barrel in that same time frame. This helped deliver motorists a second consecutive month of lower prices at the pump, as the average price of regular gas fell 16 cents in November to $3.36 per gallon, its lowest level since the start of 2023.
Fixed Income
US Treasury Yield Curve
Global Bonds