October 2023 Monthly Market Update
November 9, 2023
October 2023 Market Update
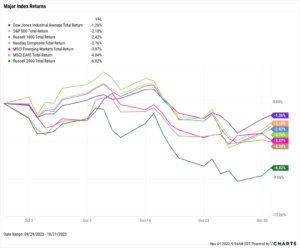
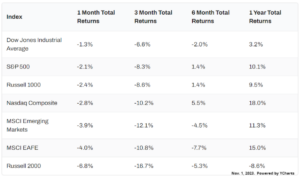
Stocks declined for the third straight month, with the Dow Jones Industrial Average falling 1.3%, the S&P 500 slipping 2.1%, and the NASDAQ giving up 2.8%. Globally, Emerging Markets fell 3.9% and EAFE lost 4.0%. Small and mid-cap stocks were the most adversely affected; the Russell 2000 dove 6.8%, while the large-cap Russell 1000 gave up only 2.4%.
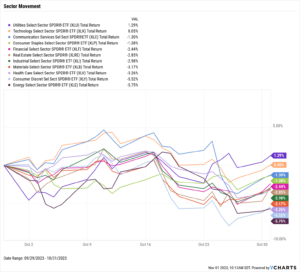
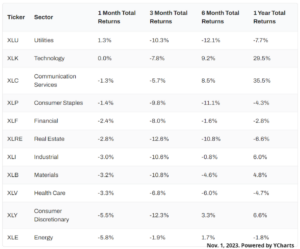
After being the only US stock sector to finish in the black for the last two months, Energy was the biggest laggard in October, with a 5.8% decline. Only Utilities and Technology advanced higher in October, up 1.3% and 0.1%, respectively.
Mortgage rates continued to shoot higher as the 15-year Mortgage Rate breached 7% for the first time since 2000, while the 30-year Mortgage Rate approached 8%. Housing prices took a hit as a result; the Median Sales Price of Existing Homes fell for the third straight month and was below $400,000 for the first time since May. The Inflation rate essentially remained the same between September and October, though Core Inflation slightly decreased. Oil prices sank in October, helping to lower the average price of regular gas by 36 cents to $3.60 per gallon.
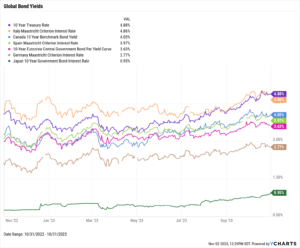
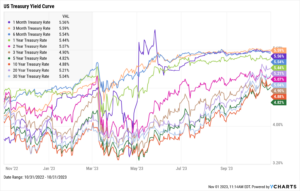
The yield curve trended toward normalcy in October. Yields on the 3-year, 5-year, 10-year, 20-year, and 30-year treasuries all increased by double-digits, with the 30-year logging the largest rise of 31 basis points. The 20-year and 30-year both eclipsed 5% for the first time since July 2007, ending the month at 5.21% and 5.04%, respectively. Italy’s Long Term Bond Interest Rate was overtaken by the US 10-year, and Japan’s 10 Year Government Bond Interest Rate neared 1% in October.
Chappell Wealth Watch! 2023 – A Year of Mega Caps
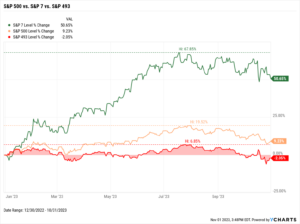
Just how important are the so-called “Magnificent Seven” stocks to the overall market this year?
If you invested in just the “S&P 7”– Apple (AAPL), Amazon (AMZN), Alphabet (GOOG, GOOGL), Meta Platforms (META), Microsoft (MSFT), NVIDIA (NVDA), and Tesla (TSLA) – on a market cap-weighted basis at the start of the year, you would have enjoyed a 50.7% return YTD.
Take those seven names out of the S&P 500, however, and the index is negative YTD.
It’s safe to say that the S&P 7 stocks have certainly played a prominent role in bringing the overall S&P 500 index up 9.2% YTD. The “Magnificent Seven” constitute roughly 29% of the S&P 500, making the index the most concentrated it has been in over 25 years.
Equity Performance
Major Indexes
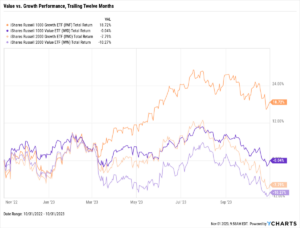
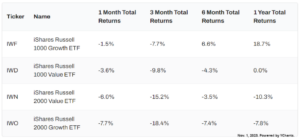
Value vs. Growth Performance
Trailing Twelve Months
US Sector Movement
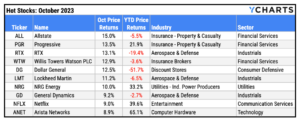
Top 10 S&P 500 Performers
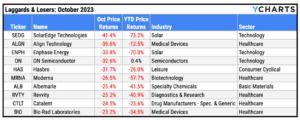
10 Worst S&P 500 Performers
Economic Data
Employment
September’s unemployment rate was unchanged at 3.8%, as was the labor force participation rate at 62.8%. However, September nonfarm payroll data showed 336,000 jobs added, the most in the last eight months and handily surpassing expectations of 159,000.
Consumers and Inflation
At 3.70%, the US inflation rate for September was essentially unchanged from August’s 3.67% level. Core Inflation decreased for the sixth straight month, down from 4.35% in August to 4.15% in September. The US Consumer Price Index MoM rose 0.40% in September, while US Personal Spending MoM accelerated 0.74%. The Federal Reserve kept the benchmark Target Federal Funds Rate unchanged at 5.50% for the second consecutive FOMC meeting, which took place on November 1st.
Production and Sales
The US ISM Manufacturing PMI dove by 2.3 points in October to 46.7, breaking a streak of three consecutive monthly increases and returning to contraction territory. US Retail and Food Services Sales MoM grew by 0.71% in September, and the YoY US Producer Price Index rose by two-tenths of a percentage point to 2.17%.
Housing
US New Single-Family Home Sales MoM rebounded by 12.3% in September following an 8.2% contraction in August. September marked the largest MoM increase for new single-family homes since August 2022. US Existing Home Sales were down 2%, sinking for the fourth consecutive month and 18th out of the last 20. The Median Sales Price of Existing Homes fell below $400,000 for the first time since May to $394,300. September also marked the third consecutive month in which median prices for existing homes fell. Mortgage rates again reached new highs in October; the 15-year Mortgage Rate topped 7% for the first time since December 2000, and the 30-year ended the month at 7.79%.
Commodities
The price of Gold rebounded 6% in October, from $1,870.50 to $1,982.90. After breaching $90 per barrel in September, the price of WTI oil reversed course in October and ended the month at $83.03 per barrel, a decline of 8.5%. The price of Brent fell 5.35% to $90.73 per barrel but stayed above that key $90 level. Lower oil prices helped deliver drivers some relief at the pump, as the average price of regular gas fell 36 cents in October to end the month at $3.60 per gallon, its lowest level since March.
Fixed Income
US Treasury Yield Curve
Global Bonds