September 2024 Monthly Market Update
October 11, 2024
September 2024 Market Summary: Equities Gain Strength, Fed Cuts Rates, and Treasury Yields Decline
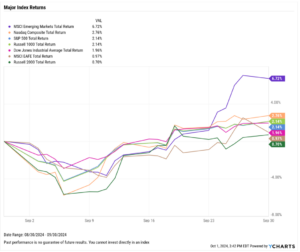
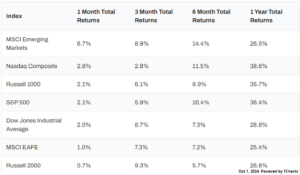
Stocks fell in the first week of September but gained strength leading up to and following the FOMC meeting on September 18th. The S&P 500 rose 2.1% in August, the Dow Jones Industrial Average advanced 2%, and the Nasdaq Composite added 2.8%. Emerging Markets was a big beneficiary of monetary policy easing, jumping 6.7% in September.
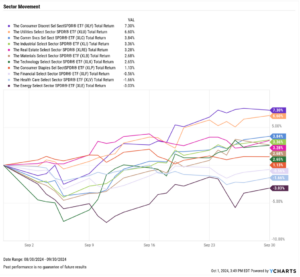
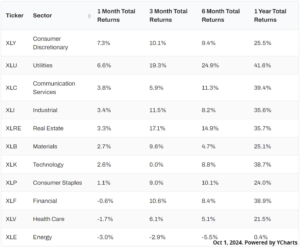
Eight of eleven sectors finished September in the black. Consumer Discretionary and Utilities led the way with respective gains of 7.3% and 6.6%, followed by Communication Services at 3.8%. Financials, Health Care, and Energy were the three sectors that went negative in September. Tumbling oil prices pushed the Energy sector 3% lower in September and into the last-place spot among all sectors.
The Federal Reserve cut its benchmark Fed Funds Rate for the first time since March 2020. The Fed Funds Rate was lowered by 50 basis points from 5.50% to 5.00% at the September 18th FOMC meeting. As a result, the 15-year mortgage rate shed 35 basis points down to 5.16%, and the 30-year approached 6%. Inflation fell for the fifth consecutive month, though core inflation inched higher.
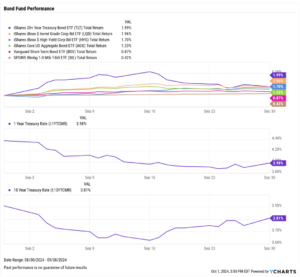
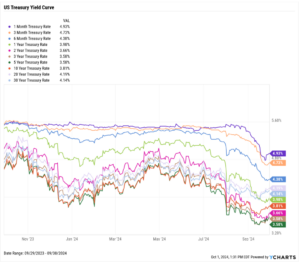
Treasury yields fell across the curve with shorter-term durations posting larger declines. The 1-month, 3-month, and 6-month T-Bills all fell around 50 basis points, reflecting the Fed’s half a percentage point rate cut. Declines were less steep further down the curve; the 10-year fell a tenth of a percentage point, and the 30-year dipped six basis points.
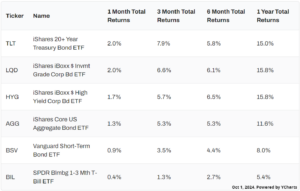
Bond funds benefitted from the Fed’s actions and declining yields. The iShares 20+ Year Treasury Bond ETF (TLT) and iShares iBoxx Investment Grade Corporate Bond ETF (LQD) both rose over 1.9%, and the Core US Aggregate Bond ETF (AGG) advanced 1.3%.
Chappell Wealth Watch! Which Asset Classes Perform Best When CPI is in Range?
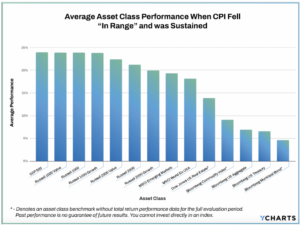
Inflation has fallen further and further toward the Fed’s 2% target since reaching a peak of 9.06% in June 2022. Now that CPI is approaching an “in-range” period that aligns with the Fed’s preferred inflation measures, it’s a fitting time to examine how various asset classes perform when stable prices are sustained.
Our latest research piece, “Which Asset Classes Perform Best as Inflation is Driven Lower?”, looks at average asset class performance when CPI was between 1.9% and 2.9% from July 31, 1996, to July 31, 2024. CPI was in this range in 105 out of 326 12-month periods, or 32.2% of the time.
Generally speaking, equities outperformed commodity and bond indices when prices were sustained. Both the Emerging Markets and Russell 2000 Growth indices posted average returns of greater than 15% during the periods mentioned above. The S&P 500, Russell 1000 and 2000, World ExUSA, and Real Estate indices all logged double-digit average returns while the three bond indices on the chart below returned less than 5% on average during periods of “in-range” CPI.
Equity Performance: Emerging Markets Pop, US Indices Advance Higher
Major Indexes
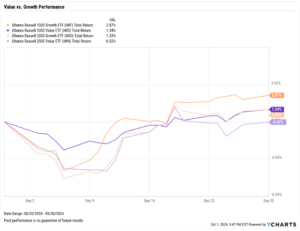
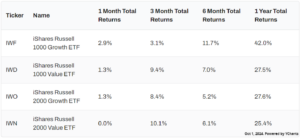
Value vs. Growth Performance
US Sector Movement
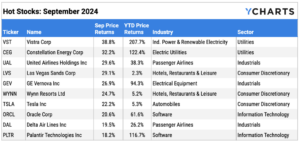
Top 10 S&P 500 Performers of September 2024
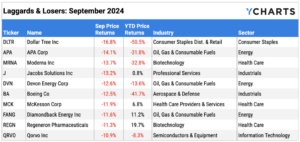
10 Worst S&P 500 Performers of September 2024
Economic Data Overview: Fed Issues First Rate Cut Since 2020, Gold Sets Another All-Time High
Employment
The unemployment rate dipped to 4.2% in August, ending a streak of four straight monthly increases. The decrease from 4.3% to 4.2% comes one month after the “Sahm Rule”, an economic rule of thumb serving as early warning of a possible recession, was triggered. The labor force participation rate remained unchanged at 62.7%. Nonfarm payroll data revealed 142,000 jobs were added in August, below the expected 161,000 but up from July’s revised figure of 89,000, which marked the lowest positive job gain for a month since May 2019.
The unemployment rate dominated financial headlines in August because its rise of 0.5 percentage points from its 12-month low of 3.8% triggered the “Sahm Rule”, which serves as an early warning sign of a possible recession. However, the rise in unemployment and weaker-than-expected job gains come as the labor force participation rate rose to 62.7% in July, making economists assess if things will be different this time.
Consumers and Inflation
The US inflation ticked lower for the fifth straight month, down to 2.53% in August; core inflation inched slightly higher to 3.20%, marking just the 2nd month out of the last 17 in which core inflation increased. Looking at the shorter-term month-over-month changes, the US Consumer Price Index rose 0.19%, and US Personal Spending increased by a quarter percent.
The Federal Reserve lowered its key Fed Funds Rate by 50 basis points at the September 18th FOMC meeting, bringing the key benchmark rate down from 5.50% to 5.00%. This was the first rate cut since March 2020, and comes after eight consecutive meetings in which the Fed maintained the Fed Funds Rate at 5.50%.
Production and Sales
The US ISM Manufacturing PMI was unchanged between August and September at a level of 47.20 and remains in contraction territory with a reading below 50. The Services PMI ticked up 0.1 points to 51.50 on the back of a 2.6-point rebound in July. The YoY US Producer Price Index fell to 1.73% in August, and US Retail and Food Services Sales were virtually unchanged in August.
Housing
US New Single-Family Home Sales contracted by 4.7% MoM, and Existing Home Sales dipped 2.5% MoM. The Median Sales Price of Existing Homes fell for a second consecutive month, by 1.1% MoM to $416,700 at the end of August. Mortgage rates fell further as expectations of a September rate cut became a reality at the September 18th FOMC meeting; the 15-year Mortgage Rate fell by 35 basis points to 5.16% while the 30-year shed 27 bps to 6.08%, both as of September 26th.
Commodities
The price of Gold surged 5.9% in September and set another new all-time high after breaking through $2,500 in August, ending the month at $2,661.90 per ounce. Crude oil prices dipped in September; the price of WTI reached a YTD low of $66.73 per barrel before settling at $71.33 on September 23rd, a decline of 4.3% for the month. Brent also set a YTD low in September before rebounding in the back half of the month to $74.95 as of September 23rd. Lower oil prices translated into lower gas prices, with the average price of gas falling by 11 cents in the month to $3.30 per gallon as of September 30th.
Fixed Income Performance: Insights into Bond ETFs & Treasury Yields
US Treasury Yield Curve
Bond Fund Performance