March 2024 Market Update: Equity Gains, Manufacturing Expansion & Mega Cap Stocks
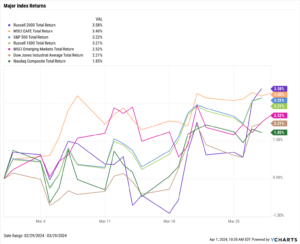
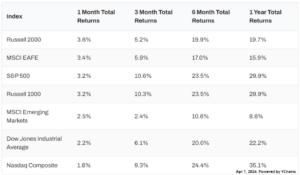
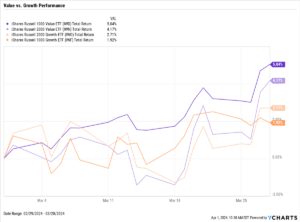
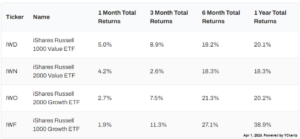
Equities continued their rally from February with modest gains in March. The S&P 500 rose 3.2% in March, the Dow Jones Industrial Average advanced 2.2%, and the NASDAQ tacked on 1.9%. Small-caps bested large-caps in March, as the Russell 2000 rose 3.6% while the Russell 1000 added 3.2%. In terms of style boxes, however, large-cap value stocks (IWD) had the best month with a 5% gain.
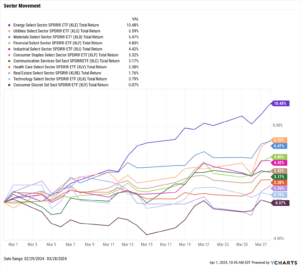
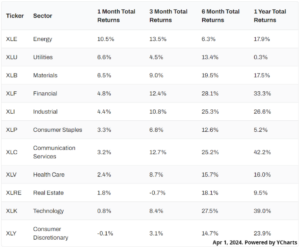
The only negative sector in March was Consumer Discretionary. XLY was in the red by just 0.07%, and this comes after leading all sectors in February with a 7.9% gain. The leader was Energy (10.5%), followed by Utilities and Materials, with gains of 6.6% and 6.5%, respectively.
Existing home sales leaped 9.5% higher in March, while new single-family home sales barely rose. The increase in sale activity lifted the median price of existing homes for the first time in eight months. The ISM manufacturing PMI entered expansion territory for the first time in 18 months. Though inflation increased slightly and core inflation deceased for the 11th straight month, gold surged to a new all-time high.
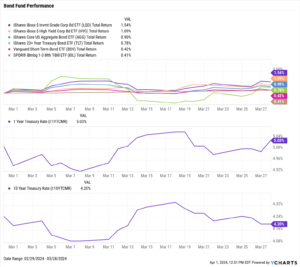
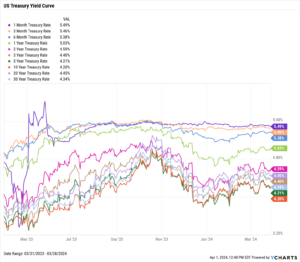
Treasury yield activity was largely muted this month. The 6-month treasury bill rose eight basis points, the most of any duration. All treasury instruments with durations of 2 years or longer saw their yields fall, but no individual decline was greater than six basis points.
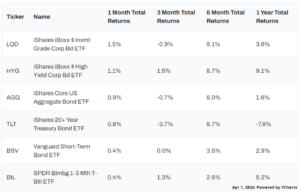
The lack of yield activity translated into little movement among bond fund performances. The iShares iBoxx Investment Grade Corporate Bond (LQD) posted a 1.5% increase, the most of any bond fund on the chart below.
Chappell Wealth Watch! $1 Trillion Market Cap Club Check-in
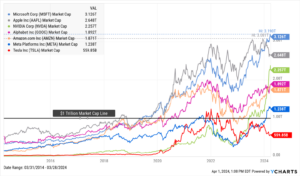
We’re already through one quarter of 2024, so let’s take a look at how the “Magnificent Seven” mega cap stocks have done so far this year.
Microsoft (MSFT) and Apple (AAPL) are trending in exact opposite directions. Microsoft’s share price has steadily risen 11.9% in 2024 and surpassed $3 trillion in market cap. Apple, on the other hand, tumbled below the $3 trillion market cap threshold due to a 10.9% decline in Q1 2024.
Aided by an 82.3% surge in Q1 2024, NVIDIA (NVDA) blew past the $2 trillion mark to a market cap of $2.26 trillion. Both Alphabet (GOOG, GOOGL) and Amazon (AMZN) have had a solid start to the year and are nearly tied in market cap.
Meta Platforms (FB) 37.2% run in Q1 2024 helped welcome the technology conglomerate back into the $1 trillion market cap club. Tesla (TSLA) shares sank 29.3% in Q1, pushing the EV manufacturer down to a market cap of $560 billion.
Major Indexes
Value vs. Growth Performance
US Sector Movement
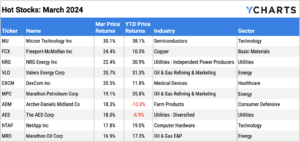
Top 10 S&P 500 Performers
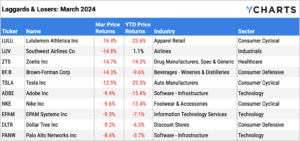
10 Worst S&P 500 Performers
Economic Data: Inflation Trends & Commodity Prices
Employment
February’s unemployment rate rose to 3.9% while the labor force participation rate stayed at 62.5% for the third consecutive month. According to nonfarm payroll data, 275,000 new jobs were added in February, beating the expected figure of 200,000.
Consumers and Inflation
The US inflation rate posted a slight increase in February to 3.15%. Inflation has now hovered in the 3-4 percent range for the last eight months. Core Inflation logged its 11th consecutive monthly decline, falling to 3.75% in February. The monthly US Consumer Price Index rose 0.44% in February, and US Personal Spending’s MoM increase of 0.76% was the highest since January 2023. The Federal Reserve held its key Fed Funds Rate at 5.50% at its March 20th, 2024 meeting, marking the fifth consecutive meeting in which the Fed left rates unchanged.
Production and Sales
The US ISM Manufacturing PMI surged 2.5 points to 50.3, reaching expansion territory for the first time since October 2022. February US Retail and Food Services Sales rebounded by 0.6% MoM, while the YoY US Producer Price Index increased by 1.6%.
Housing
US New Single-Family Home Sales slipped 0.3% MoM in February, but US Existing Home Sales jumped 9.5% MoM. The demand pushed the Median Sales Price of Existing Homes up 1.6% in February to $384,500, putting an end to a seven-month streak of declines. Mortgage rates decreased slightly in February; the 15-year Mortgage Rate fell to 6.11% as of March 28th, and the 30-year came down to 6.79%.
Commodities
The price of Gold jumped 8.1% in March on news of possible June rate cuts, even as the dollar and treasury yields climbed. Gold ended the month at $2,214.40 per ounce, and the SPDR Gold Shares ETF (GLD) set a new all-time high as well. Crude oil prices continued steadily higher in March following a trough in December 2023; the price of WTI advanced 4% to $82.41 per barrel while Brent rose 1.9% to $86.18 both as of March 25th. Higher oil prices also pushed the average price of gas 27 cents higher to $3.64 per gallon as of the final week of the month, further forming a “U-shaped recovery”.
Fixed Income: Insights into Bond ETFs & Treasury Yields
US Treasury Yield Curve
Bond Fund Performance