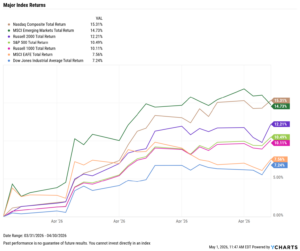
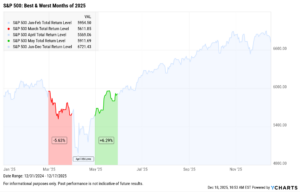
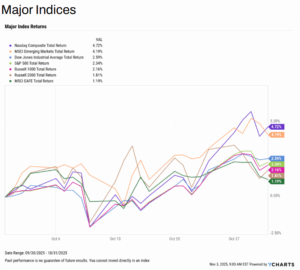
Market Summary: Yields Rise Sharply as S&P 500 Posts Worst Month Since September 2022
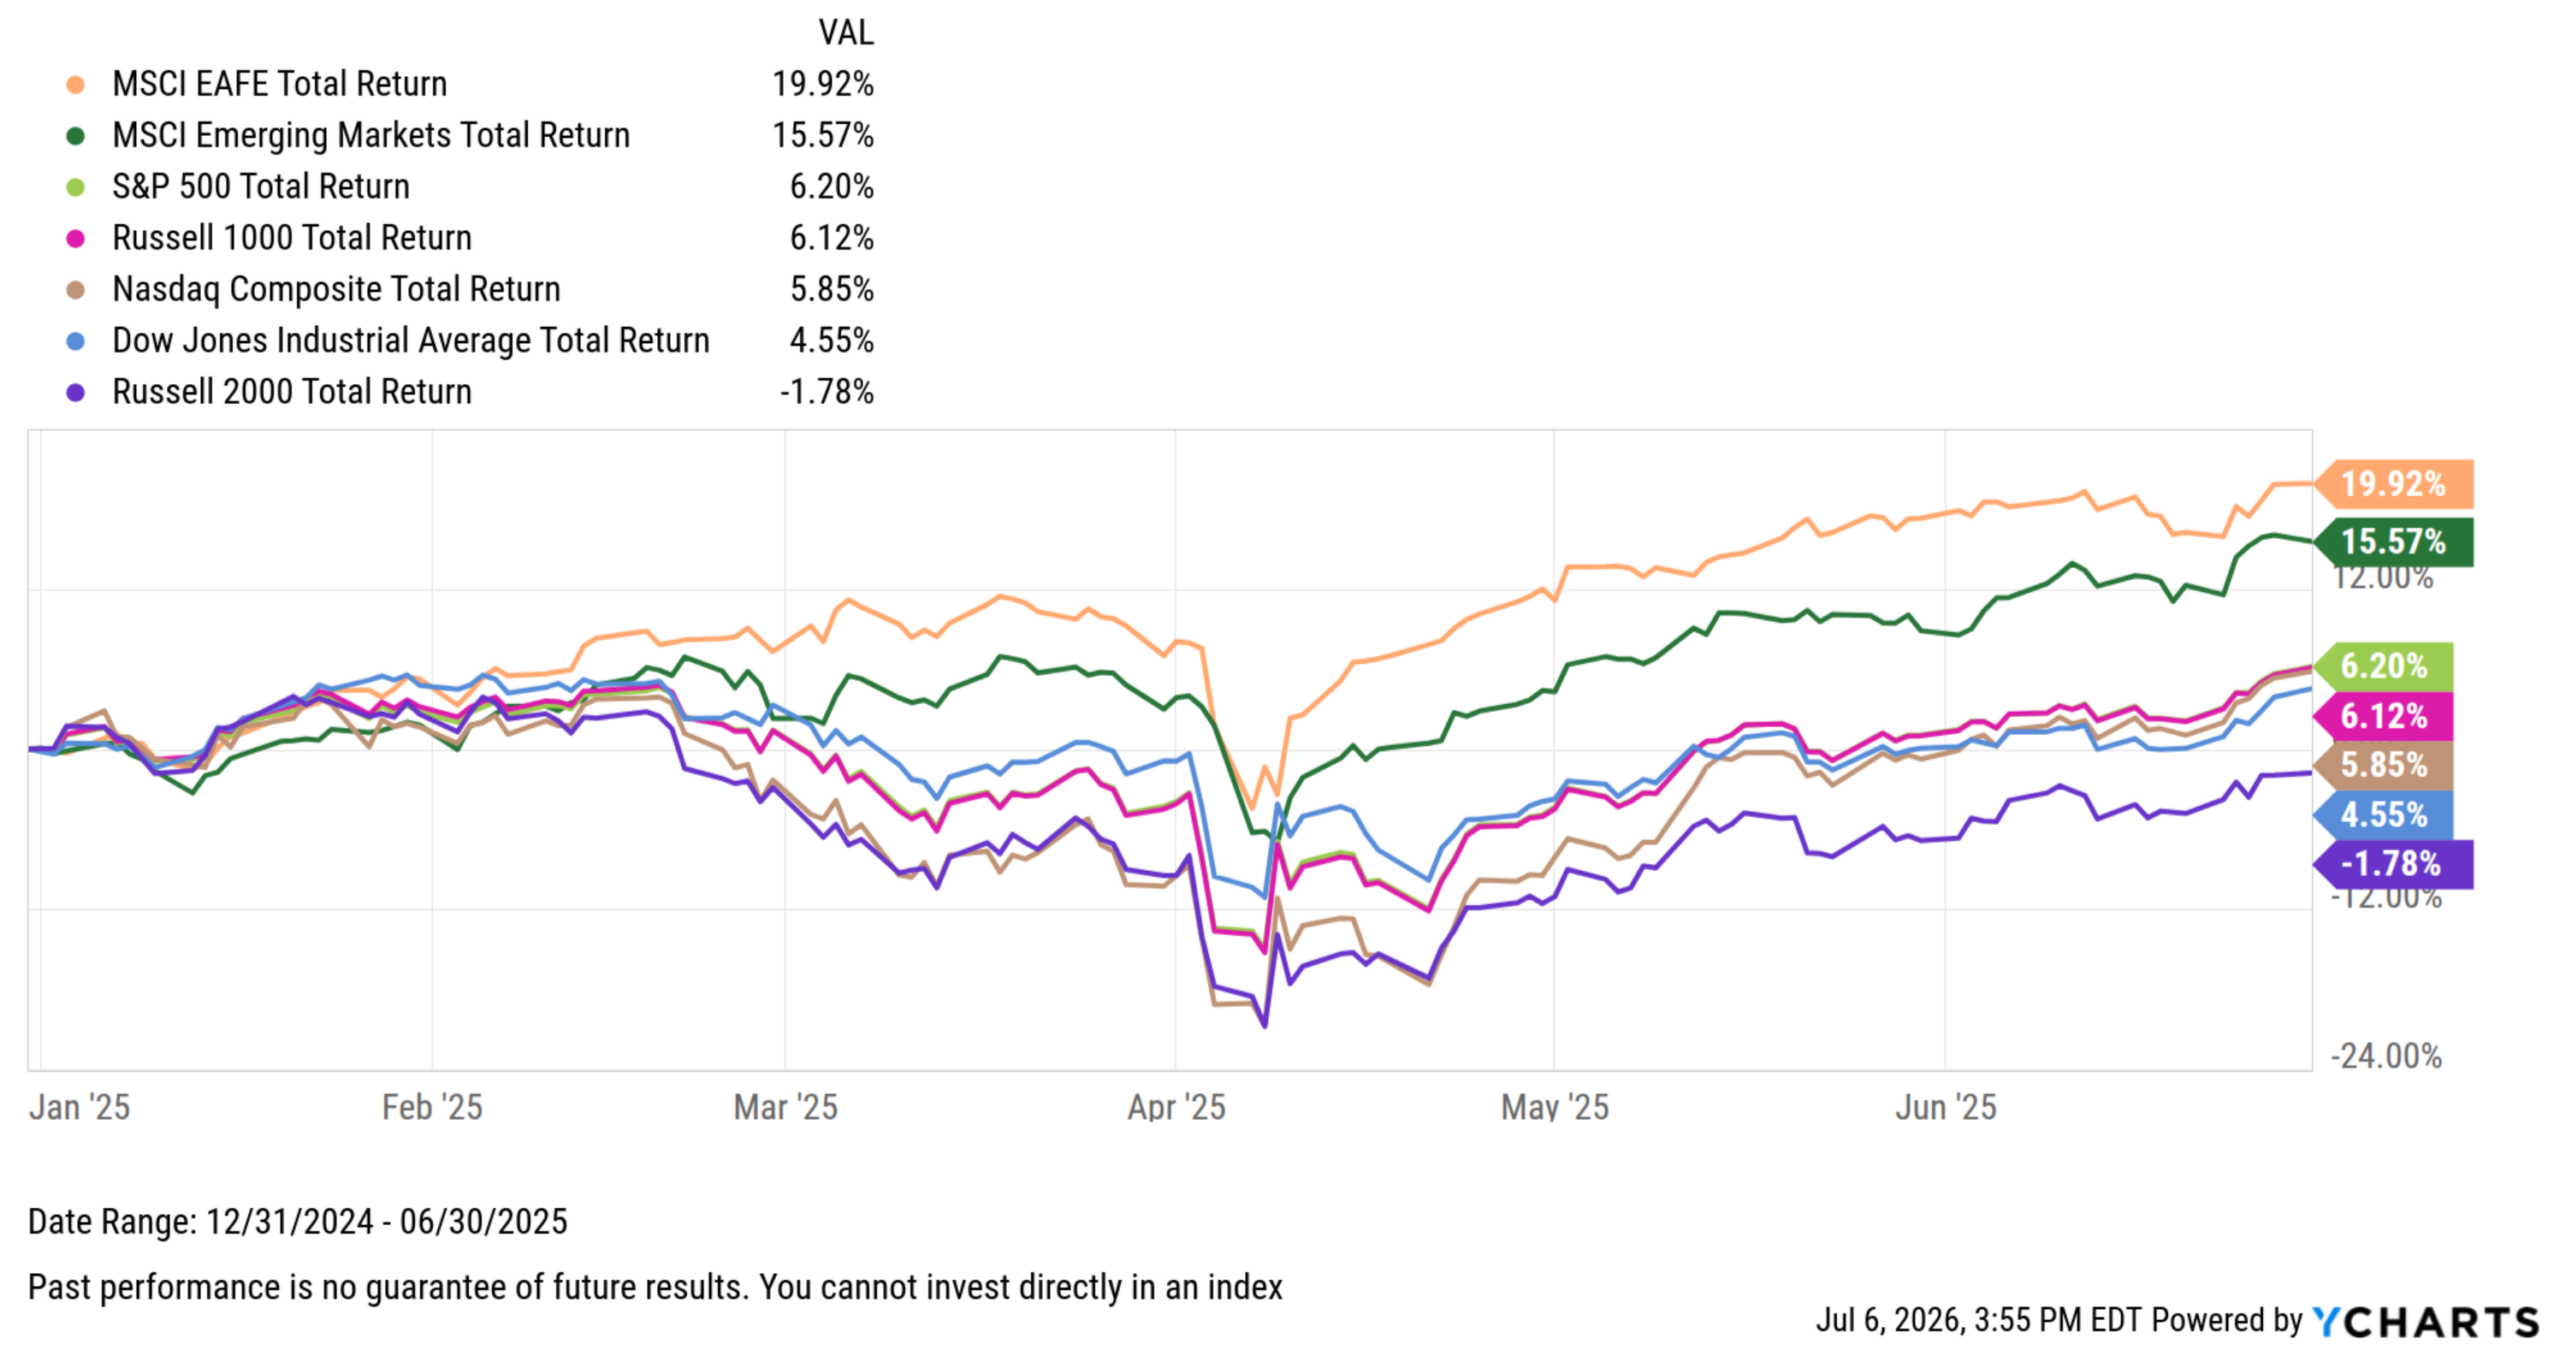
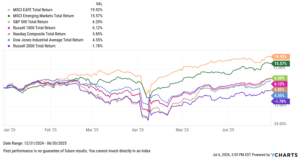
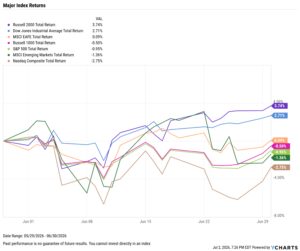
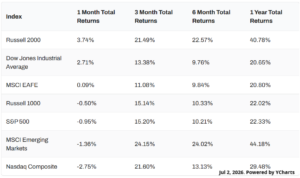
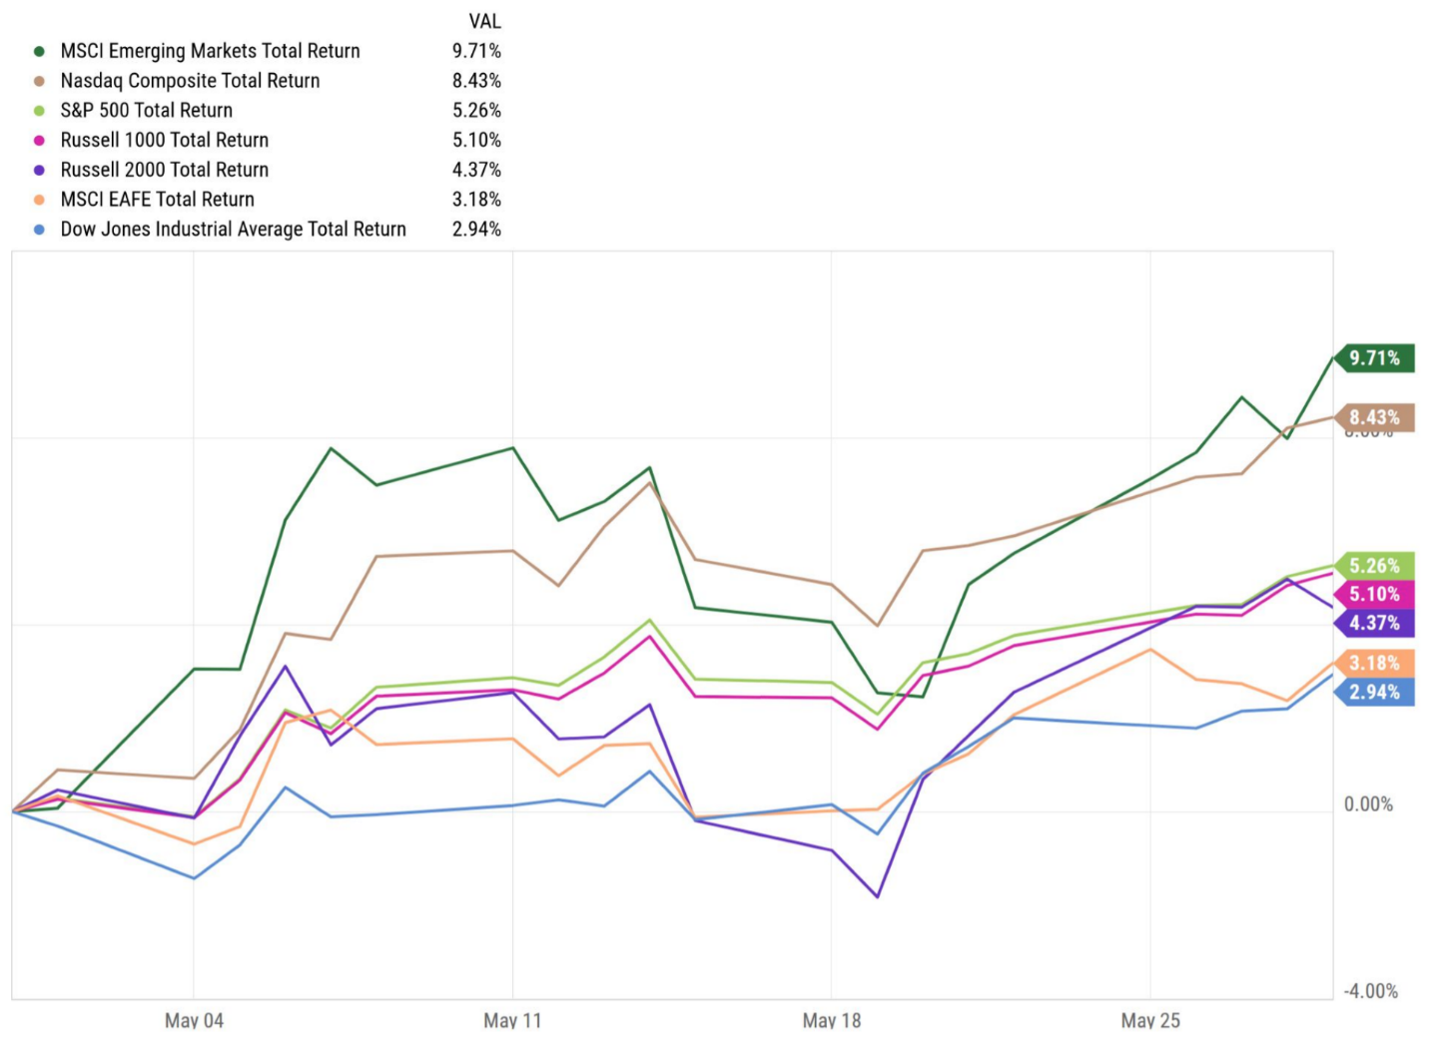
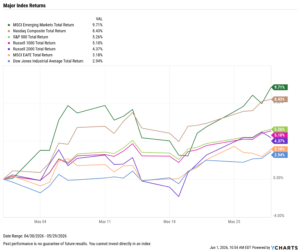
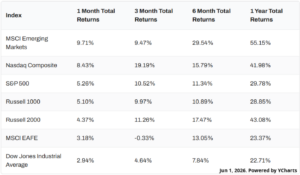
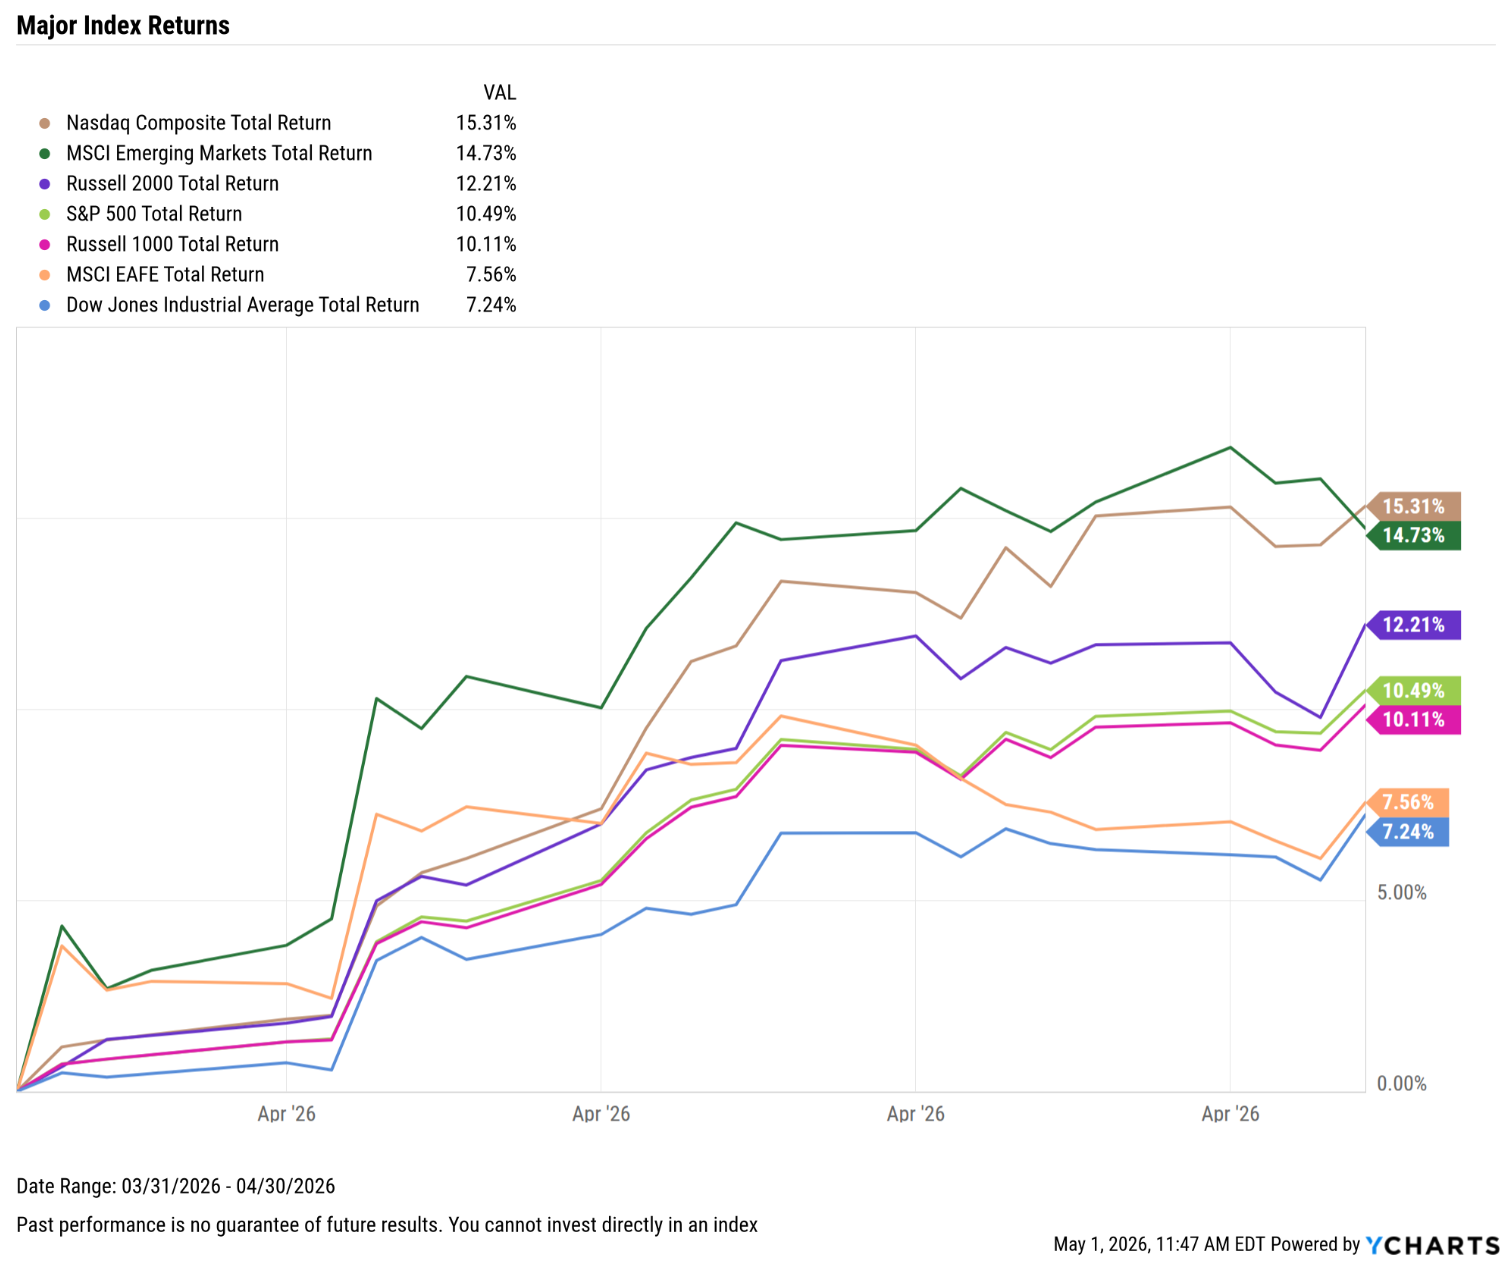
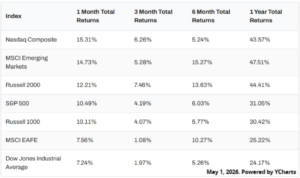
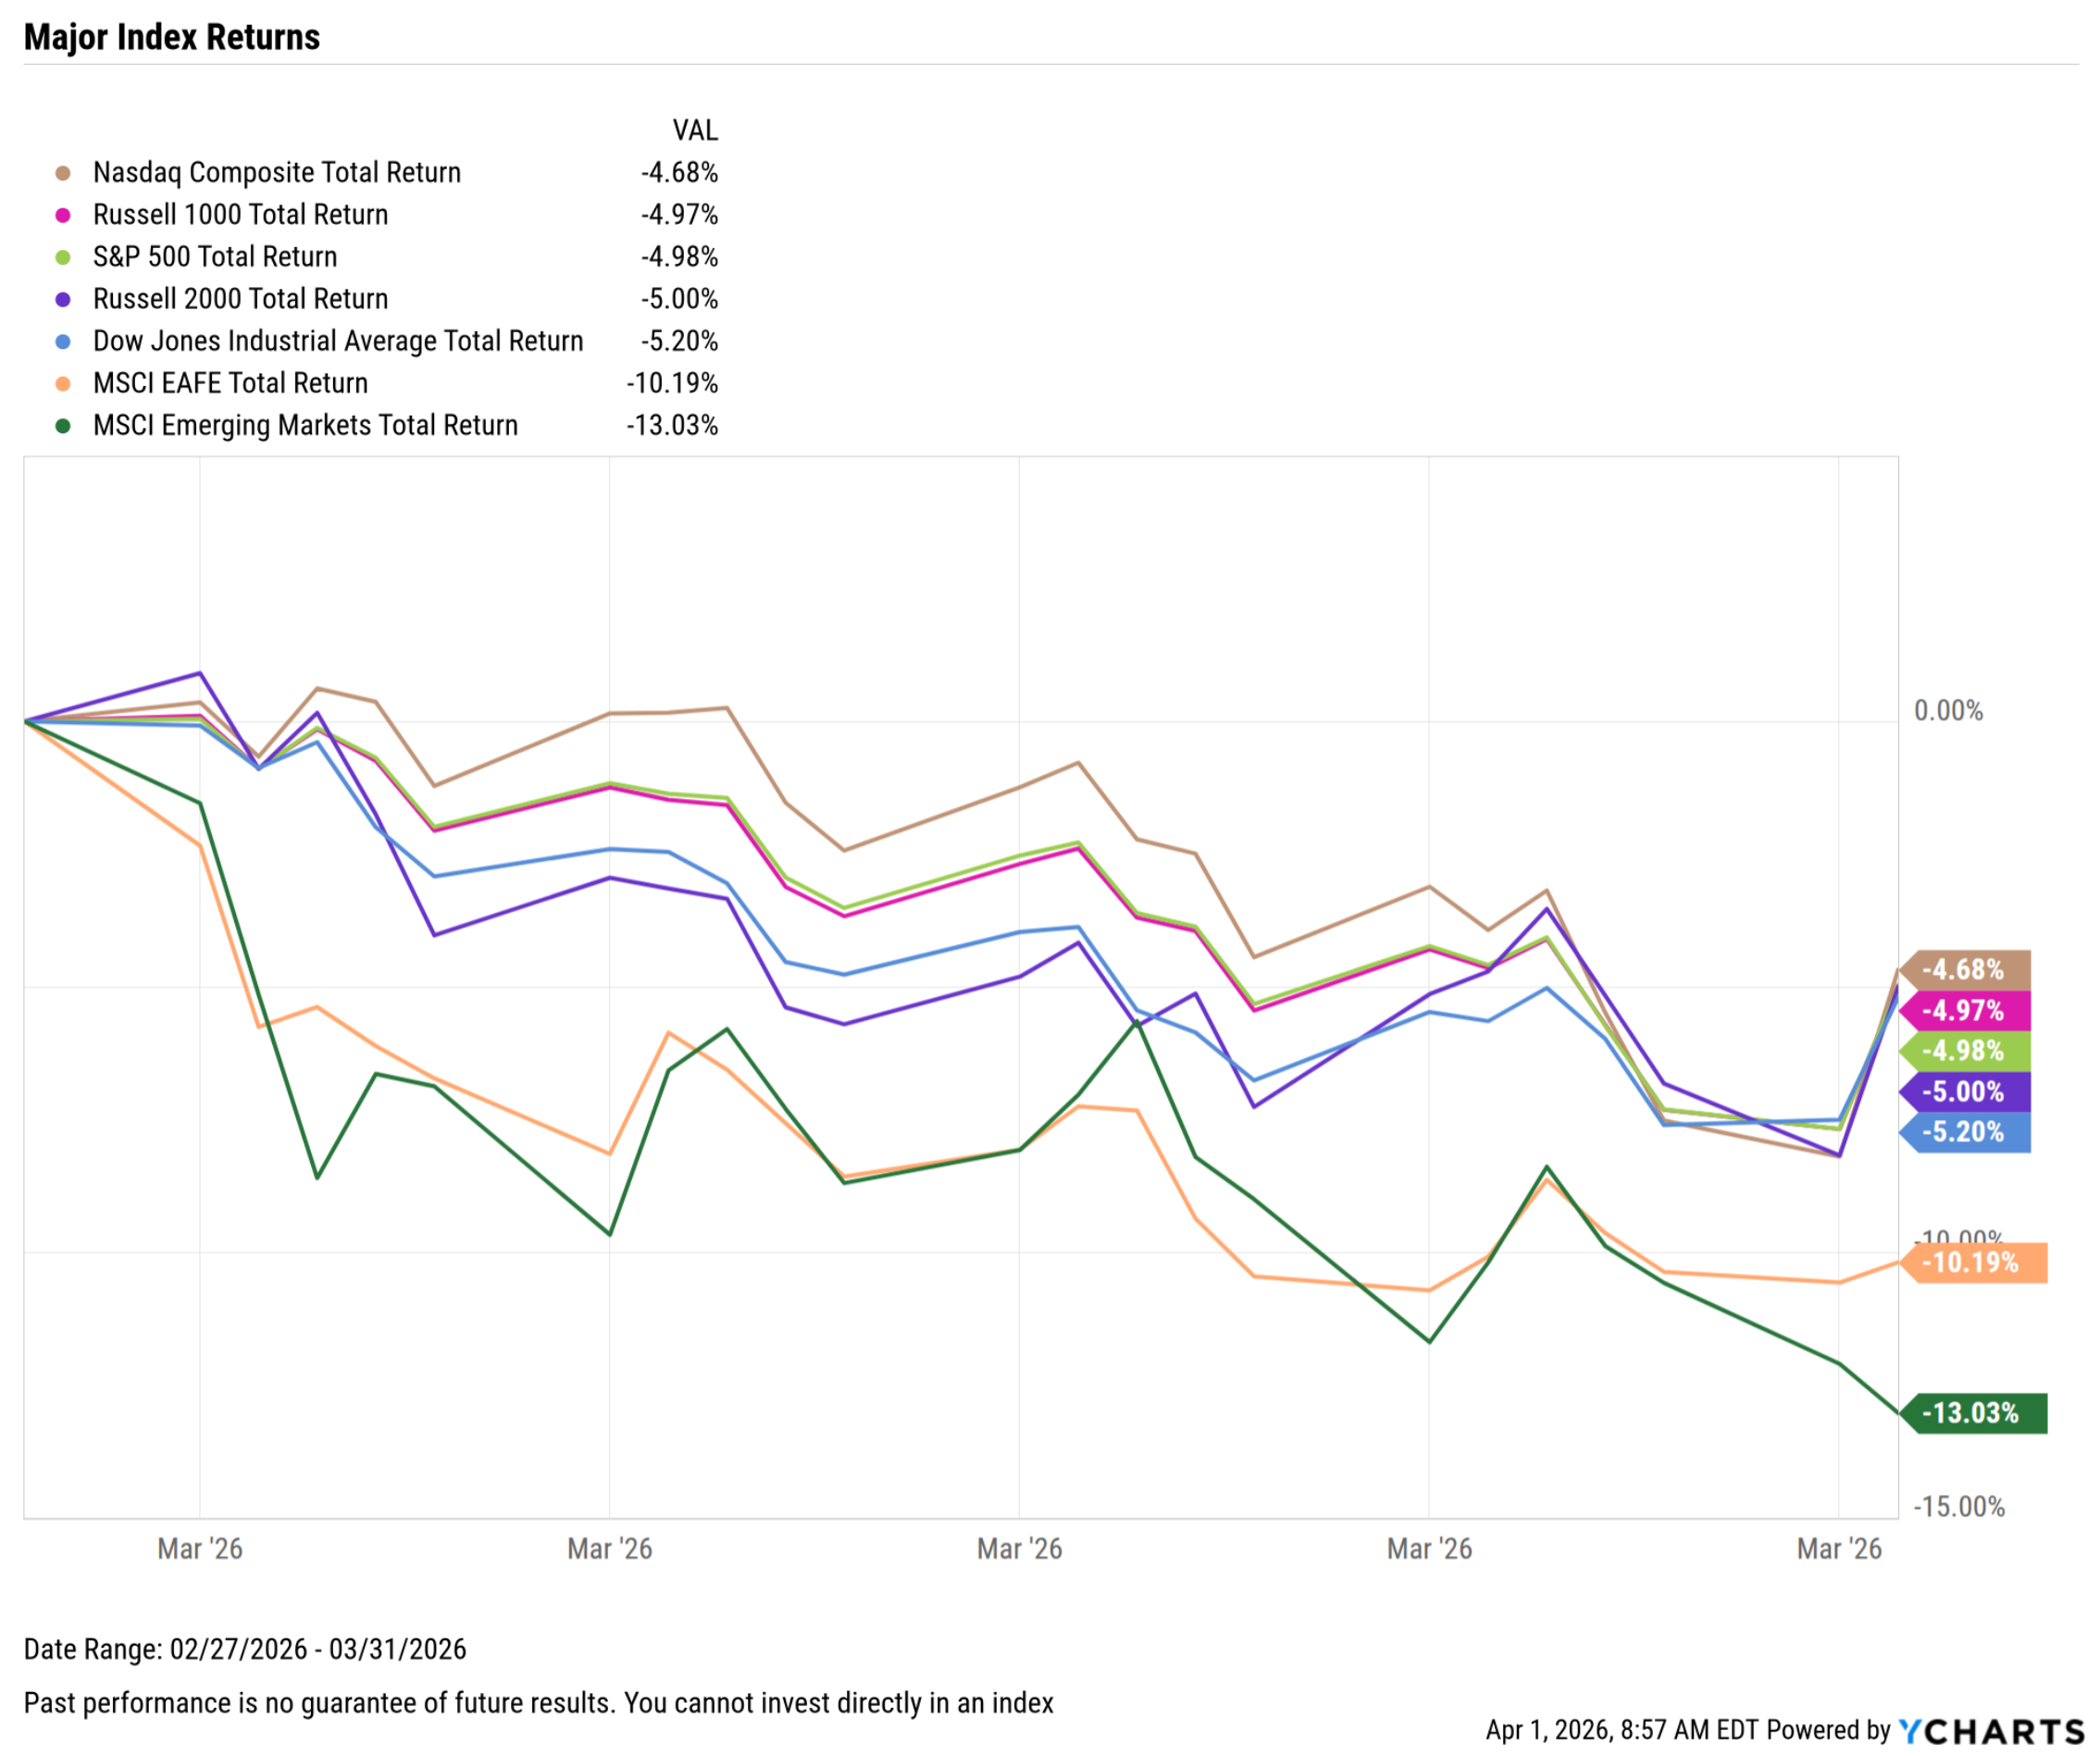
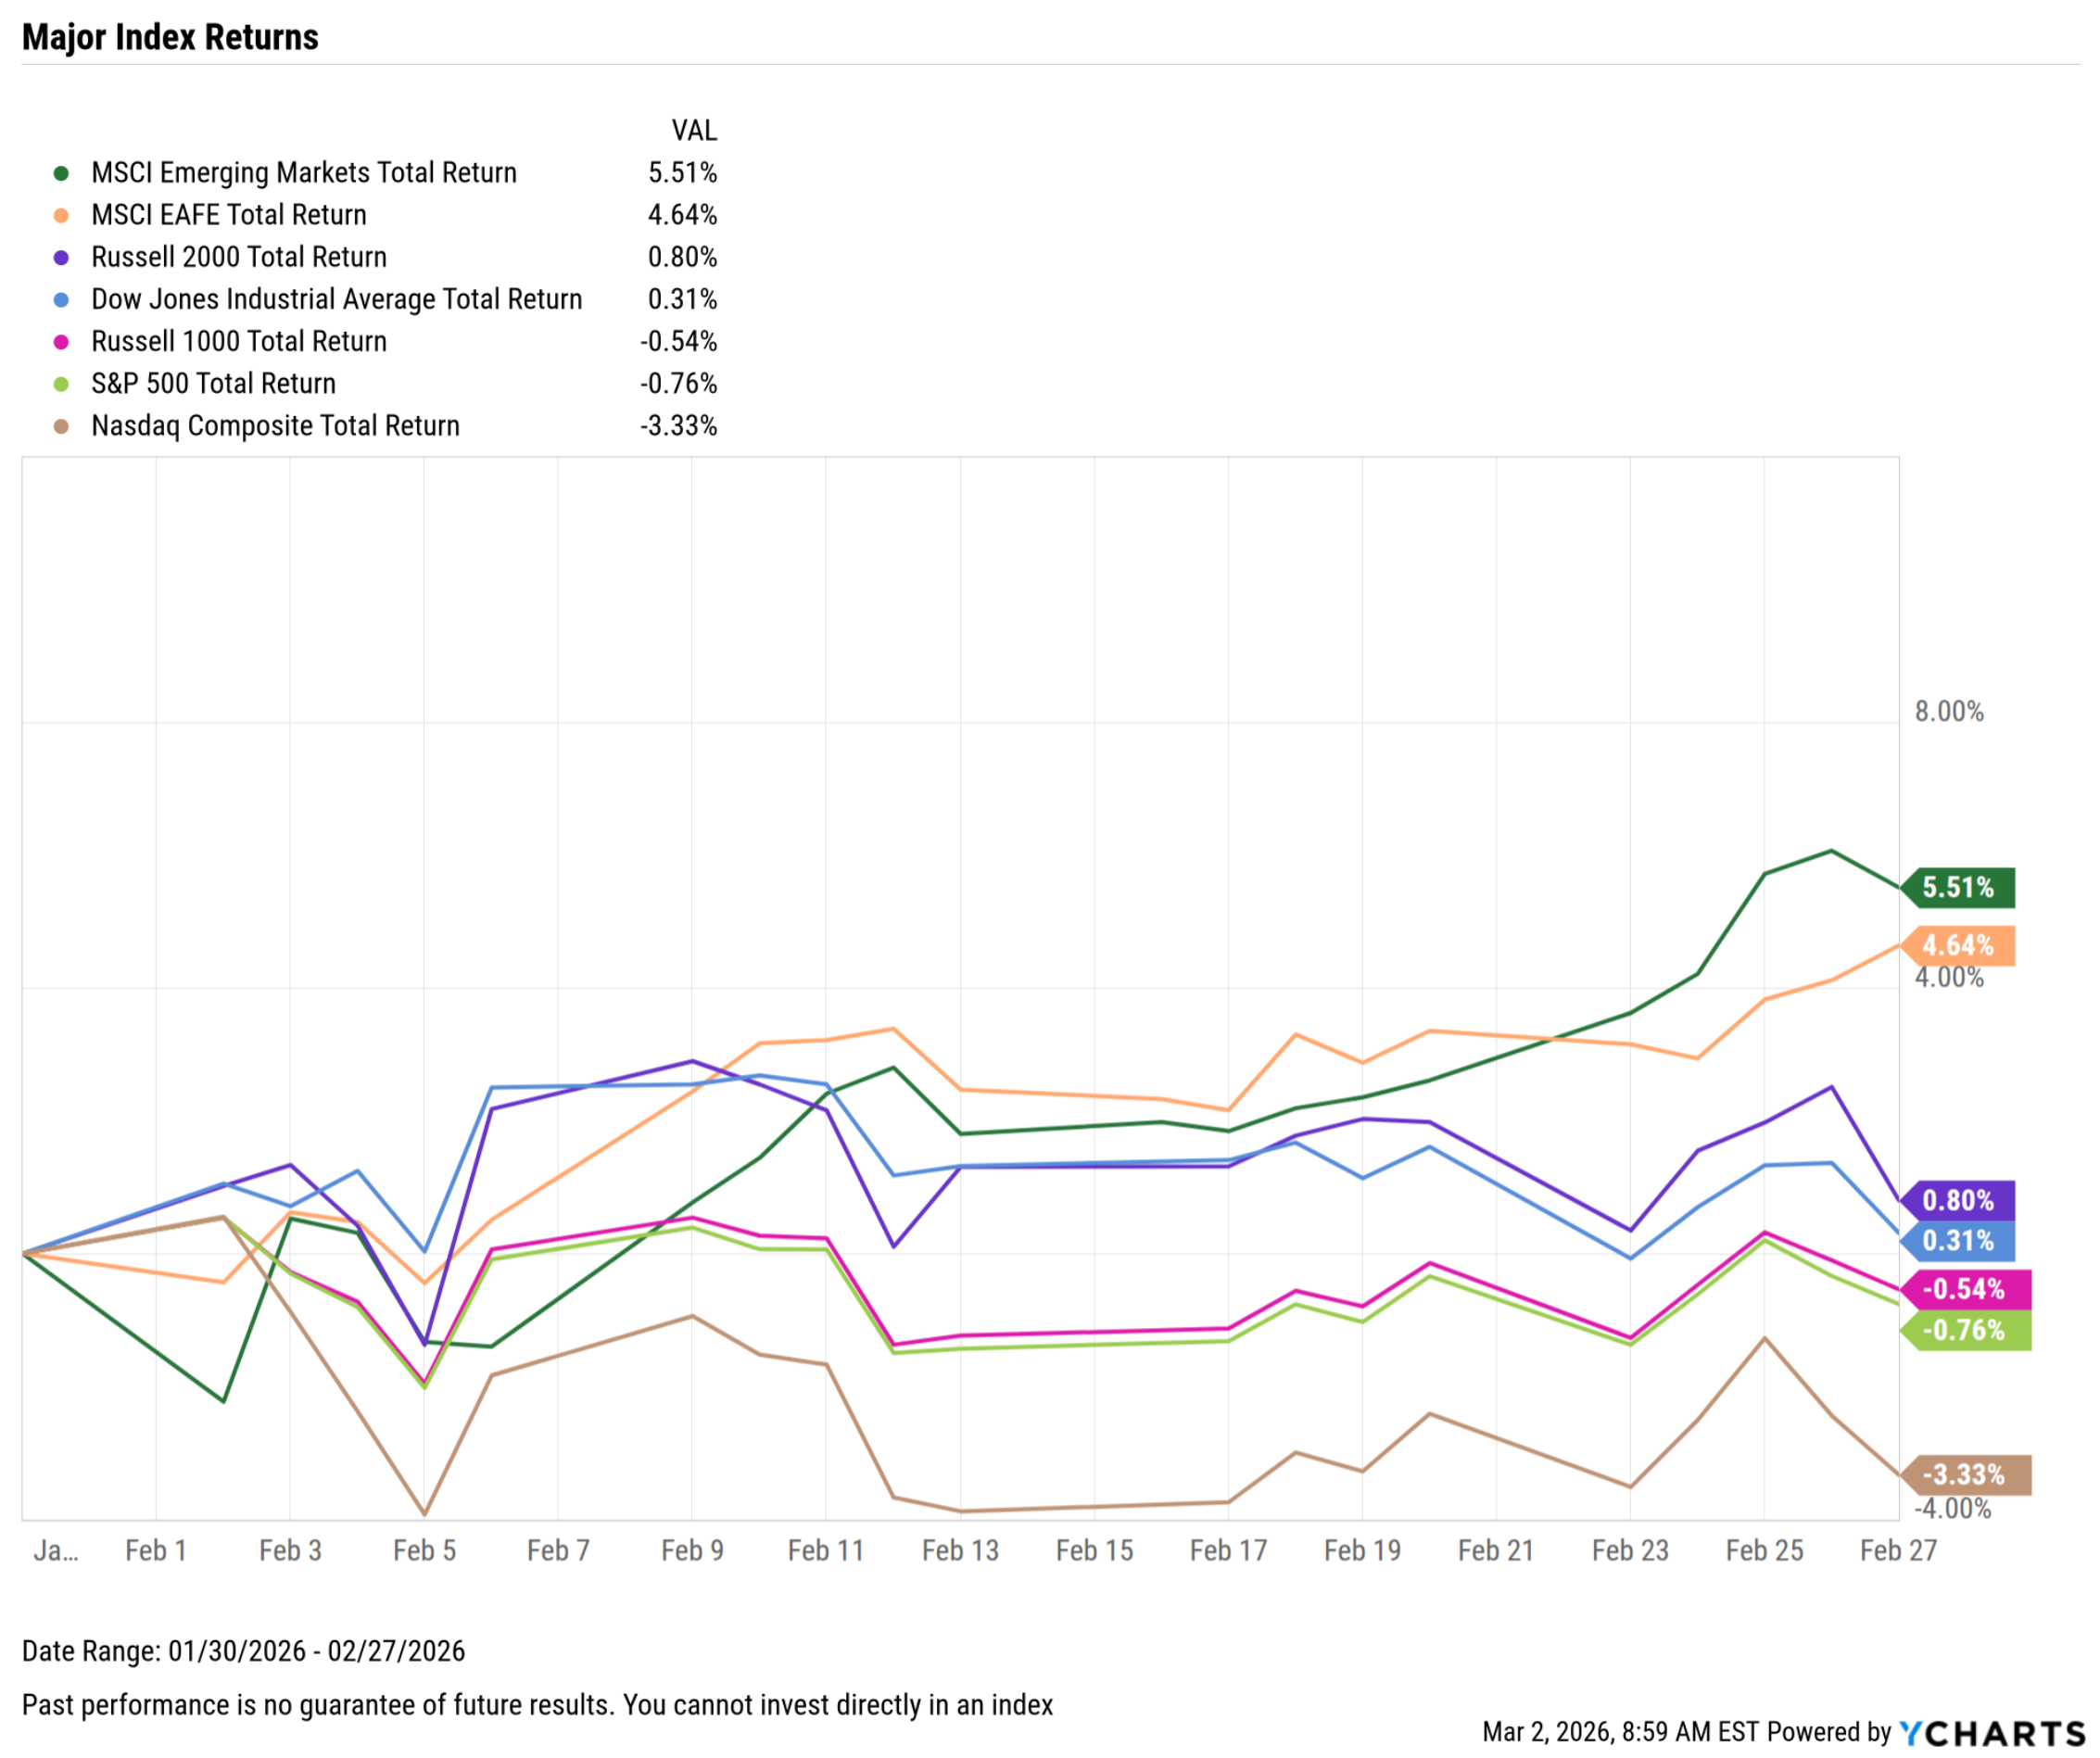
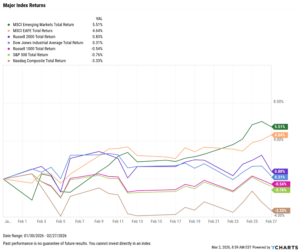
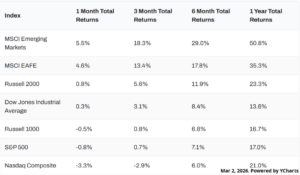
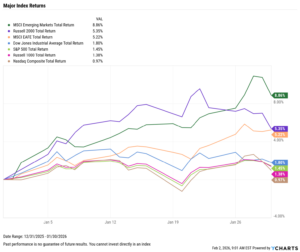
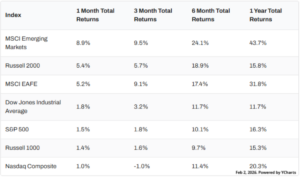
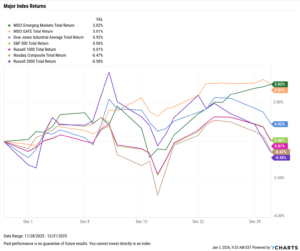
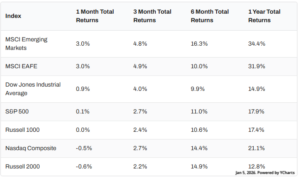
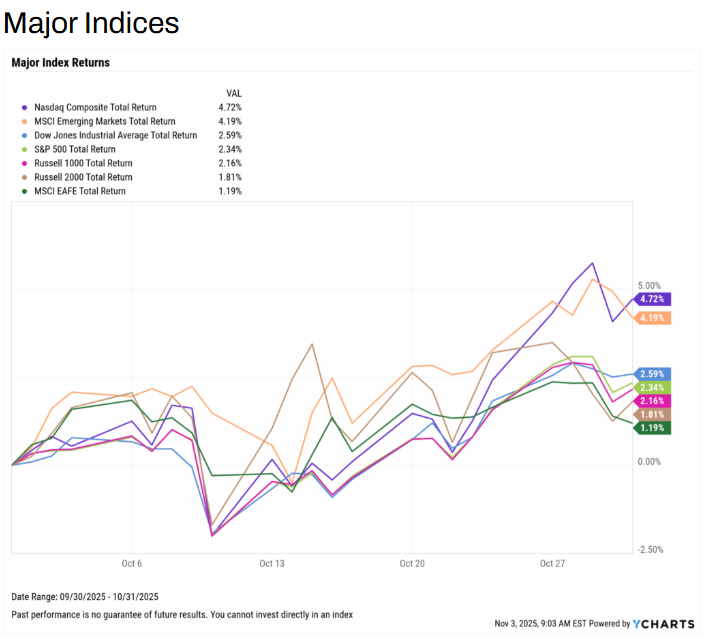
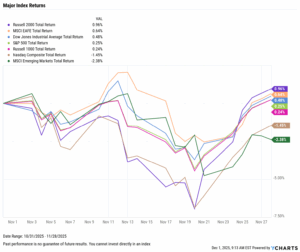
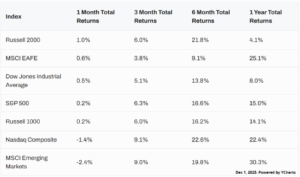
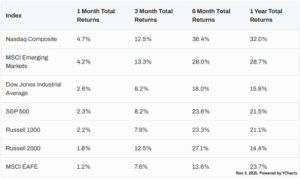
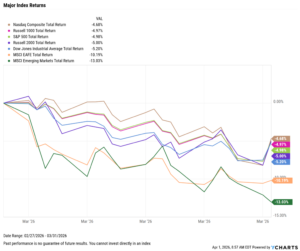
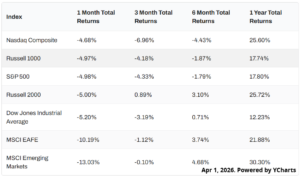
Markets fell hard in March, with Emerging Markets posting the worst month, down 13%. The S&P 500 and Nasdaq both dropped by nearly 5%, and all major indices were negative for the month.
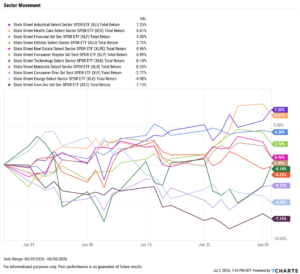
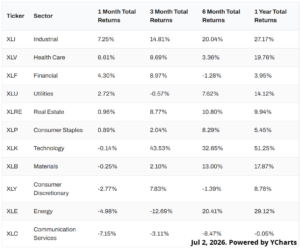
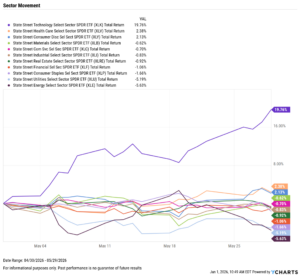
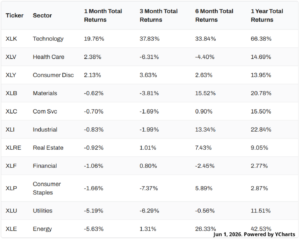
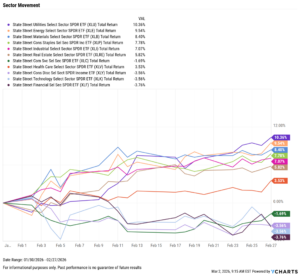
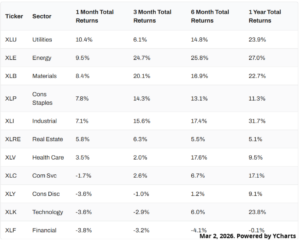
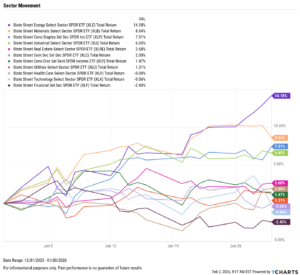
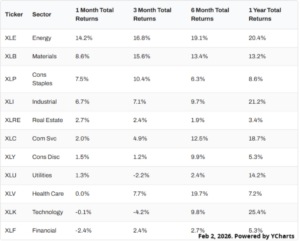
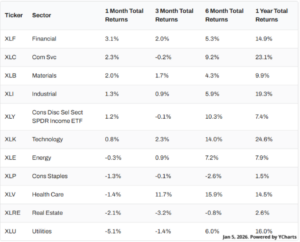
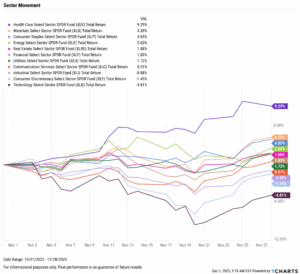
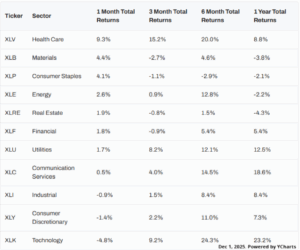
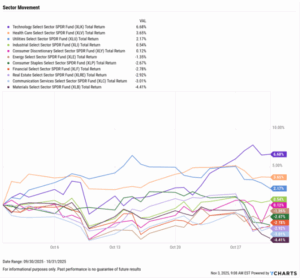
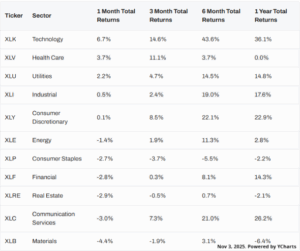
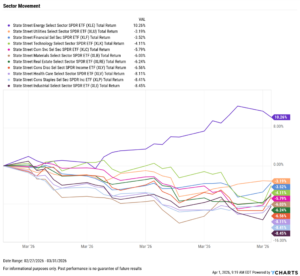
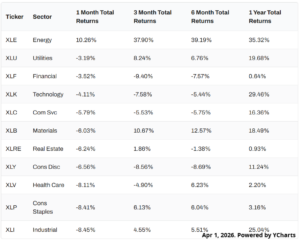
Sector performance followed a similar path, with all but one sector falling by more than 3% in March. The lone exception was Energy, which advanced 10.3% due to energy constraints resulting from the U.S. strikes on Iran in late February. This marks two consecutive months of near 10% gains in this sector.
The Federal Reserve’s next meeting is scheduled for April 29th, though expectations for any rate cut remain muted at less than 1%. Nonfarm payrolls fell by a worrisome 92,000 jobs in the same period which the unemployment rate ticked up by 0.1 percentage points to 4.4%.
The Median Sales Price of Existing Homes increased modestly to $398,000, though US New Single-Family Home Sales experienced its worst MoM decline in nearly 13 years, falling 17.56% in January. The US inflation rate remained unchanged in February at 2.40%, as did core inflation at 2.50%.
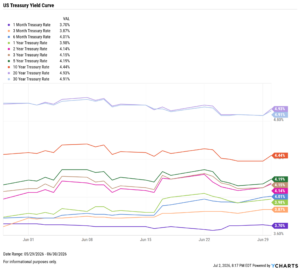
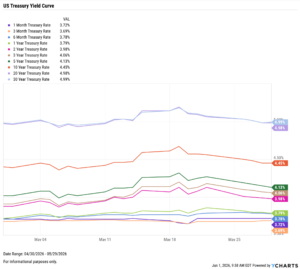
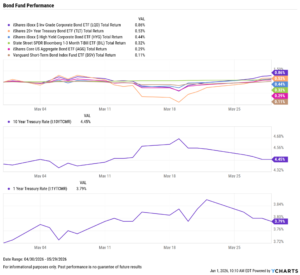
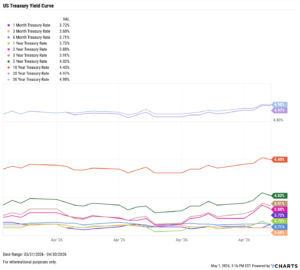
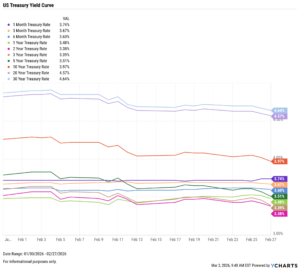
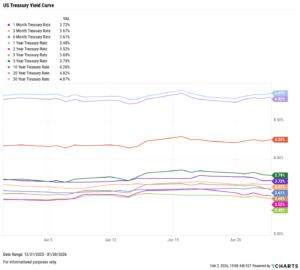
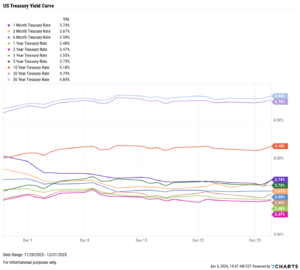
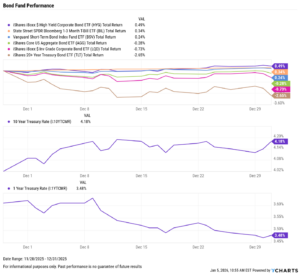
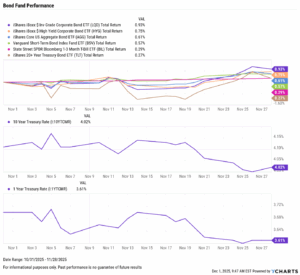
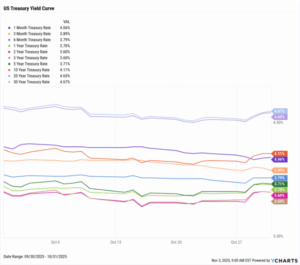
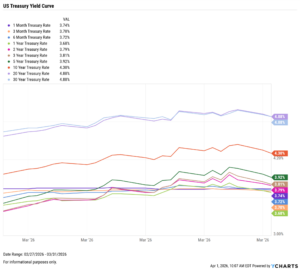
Treasury yields rose sharply in March, with the 1-month the lone exception, remaining unchanged at 3.74%. The 3-year saw the biggest advancement, up 42 bps to 3.81%. The 2-, 5-, 10-, and 20-year all ticked up by more than 30 bps.
Chappell Wealth Watch! Oil Surges on Iranian Conflict
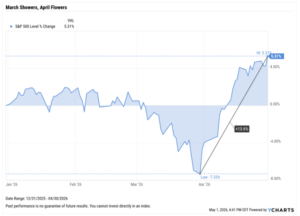
March unveiled the full effects of the United States’ strikes on Iran in late February, resulting in the worst month for the S&P 500 since September 2022. While global indices, asset classes, and equity styles all felt the shockwave, none reacted quite as heavily as oil.
The most immediate effects of Middle Eastern conflicts are seen in oil prices, as markets quickly factor in the risk of disrupted supply and transportation. This became evident in March, as the price of Brent crude reached over $100 per barrel for the first time since August 2022.
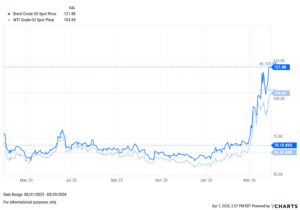
In March alone, Brent crude rose by 70.9%, as WTI increased by 50.4%. To contextualize this leap, during the opening month of the Gulf War in 1990, Brent Crude rose only as high as 45% at its peak.
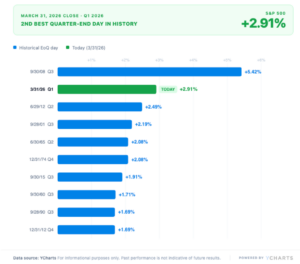
The energy sector was a beneficiary as well, up 9.6%, and the only sector not to retreat in March. While equity markets trended downward for most of the month, the final trading day brought some reprieve. On rumors that Iran and the United States had made progress towards a deal, the S&P posted its second-best end-of-quarter day in history.
For advisors, history continues to favor those who have stayed disciplined through periods of geopolitical stress. This period can feel uniquely consequential in real time for clients, but markets have repeatedly moved beyond the initial shock period.
Oil prices, international equities, and sector-level moves all deserve attention as they influence broader economic sentiment, but it is key to help clients understand that remaining invested through uncertainty has mattered more than reacting to it.
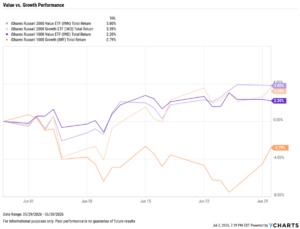
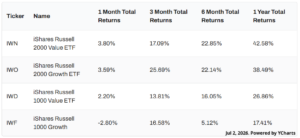
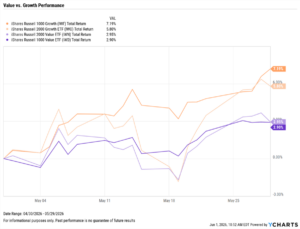
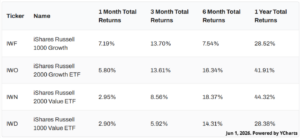
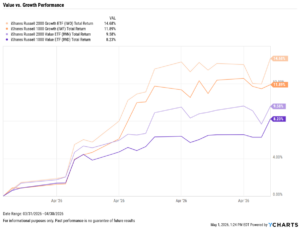
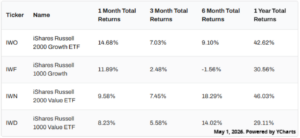
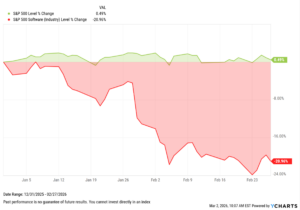
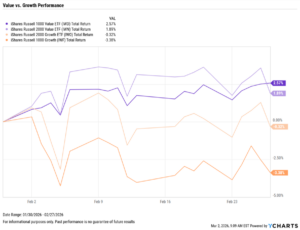
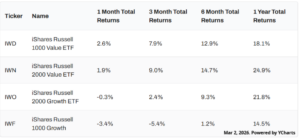
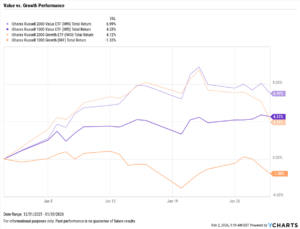
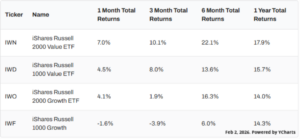
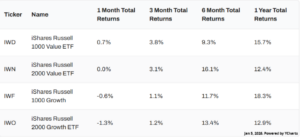
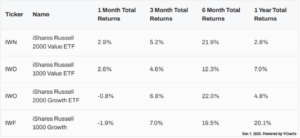
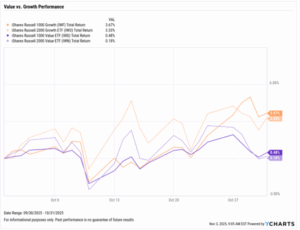
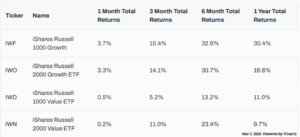
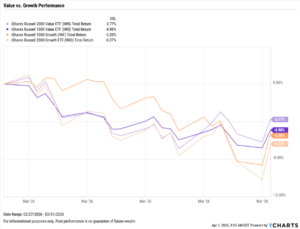
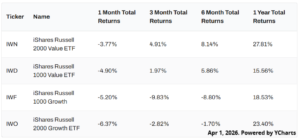
Value vs. Growth Performance
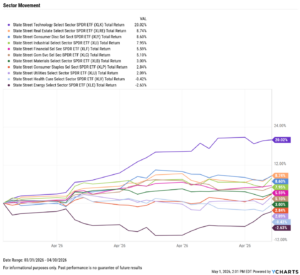
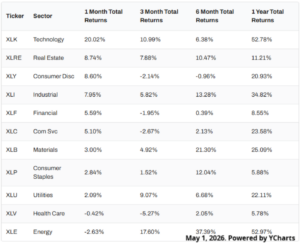
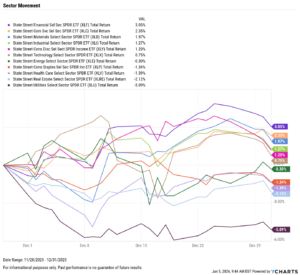
US Sector Movement
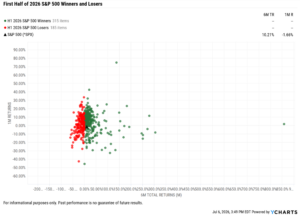
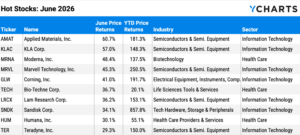
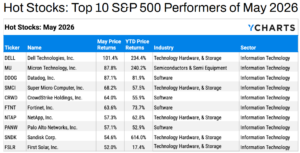
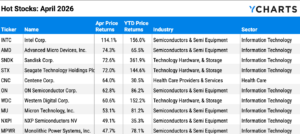
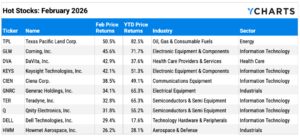
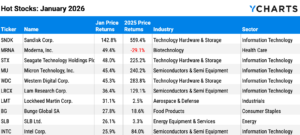
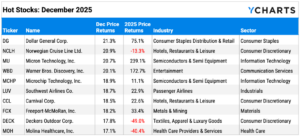
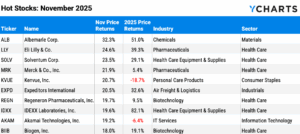
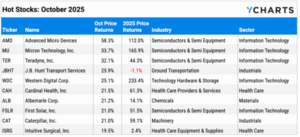
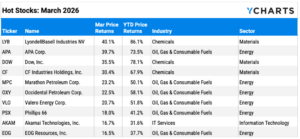
Top 10 S&P 500 Performers of March 2026
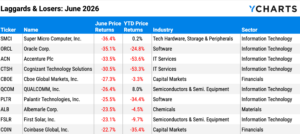
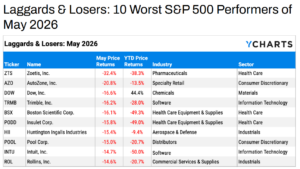
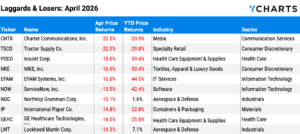
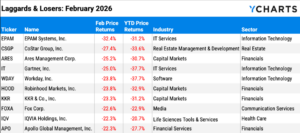
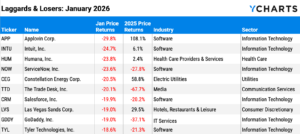
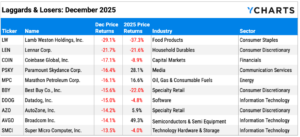
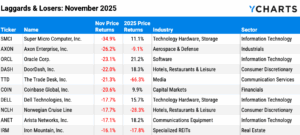
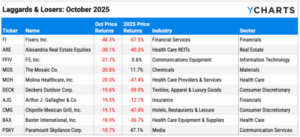
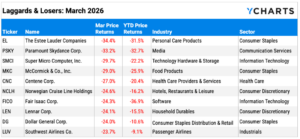
10 Worst S&P 500 Performers of March 2026
Economic Data Overview: Unemployment Picture Worries, Inflation Unchanged, Oil Skyrockets on Iran Conflict
Employment
The unemployment rate increased by 0.1 percentage points to 4.4%, and the U.S. economy lost 92,000 jobs according to the most recent nonfarm payrolls report. This came in well below the Dow Jones estimate of 50,000. The US Labor Force Participation Rate decreased by 0.1 percentage points to 62.00% in February.
Consumers and Inflation
The US inflation rate remained unchanged in February at 2.40%, as did core inflation at 2.50%.The CME FedWatch tool indicates less than 1% chance of the first rate cut in 2026 during the FOMC’s next meeting on April 29th. Rates were held steady at 3.50-3.75% in March, as Jerome Powell’s term winds closer to an end.
Production and Sales
The US ISM Manufacturing PMI increased MoM for the second consecutive month to 52.7. The Services PMI increased sharply MoM to 56.1, as both are signaling continued expansion. The YoY US Producer Price Index rose 3.40% in February, while the US Retail and Food Services Sales increased by 0.60% on the month.
Housing
Existing Home Sales increased by 1.74% MoM in February, following its largest monthly decline since April of 2020. The Median Sales Price of Existing Homes increased modestly to $398,000, a second consecutive reading below $400,000.
Mortgage rates upticked in March, ending the month at 5.75% for the 15-year and 6.38% for the 30-year. US New Single-Family Home Sales experienced its worst MoM decline in nearly 13 years, falling17.56% in January.
Commodities
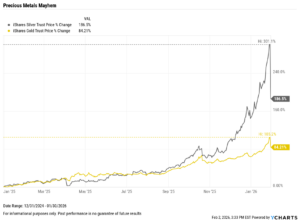
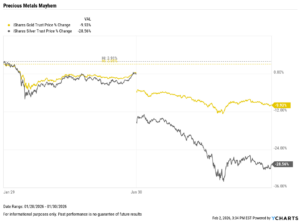
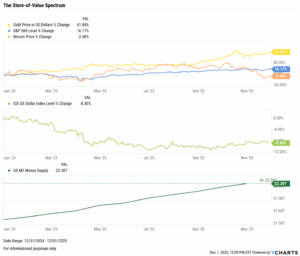
Gold experienced an 11% drop in March, leaving SPDR Gold Shares ETF (GLD) trading at $430.29 per share. Silver was hit harder, down 19.8% to end the month, following a run-up of more than 100% in the six months prior.
Oil prices were the standout story in March due to the conflict in Iran. Geopolitical tension in the Middle East has strained oil supply, sending Brent crude over $100 per barrel for the first time since August 2022. Brent crude rose by 70.9%, as WTI increased by 50.4% to $104.69.
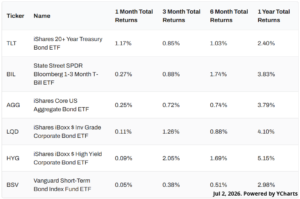
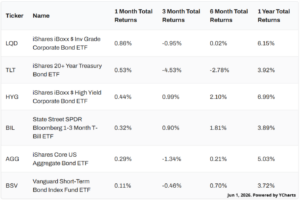
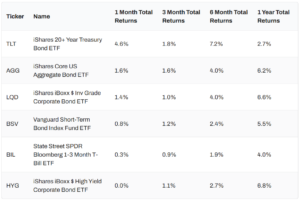
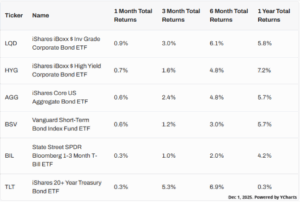
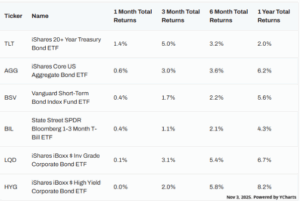
Fixed Income Performance: Insights into Bond ETFs & Treasury Yields
US Treasury Yield Curve
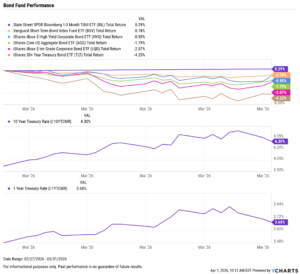
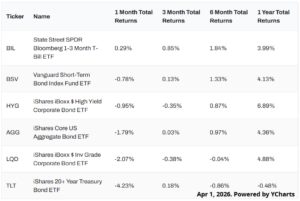
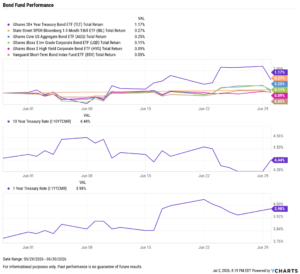
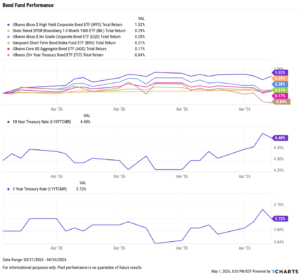
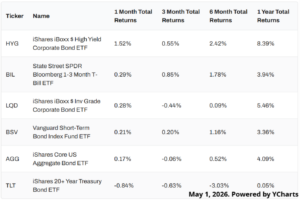
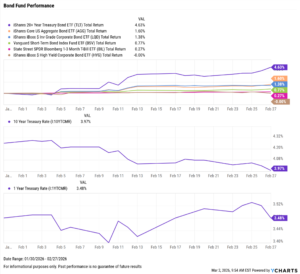
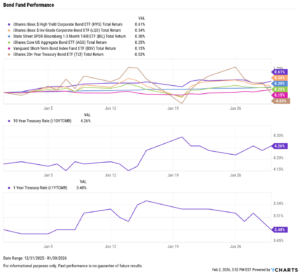
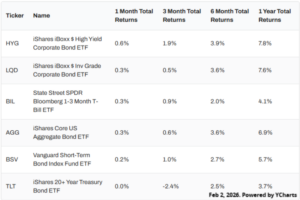
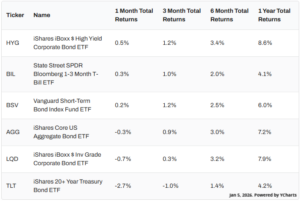
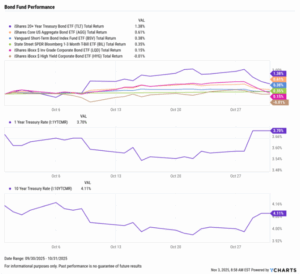
Bond Fund Performance