December 2024 Market Summary: Stocks End 2024 on a Mixed Note, Fed Cuts Interest Rate, Bond Funds Rise as Yield Fall
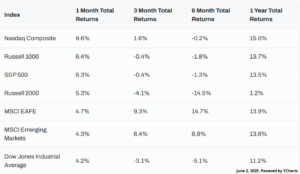
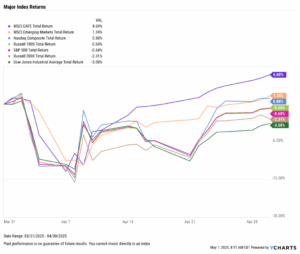
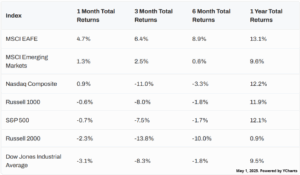
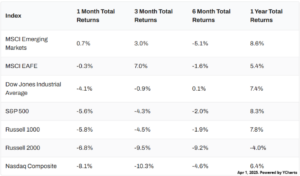
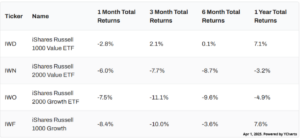
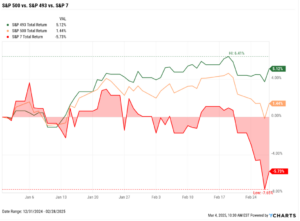
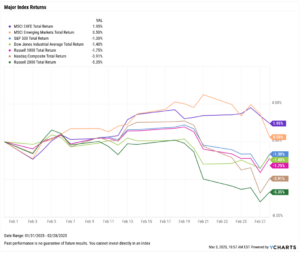
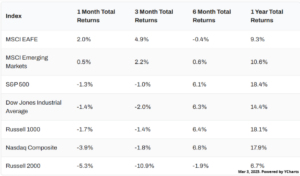
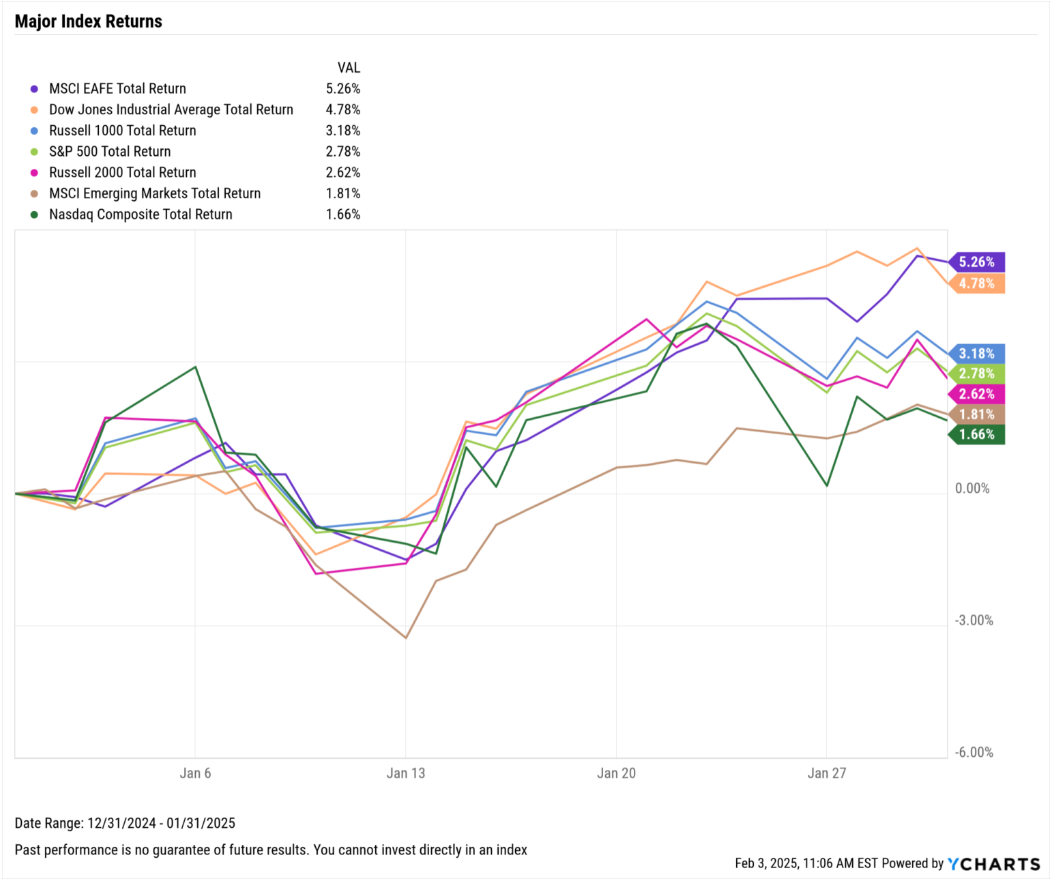
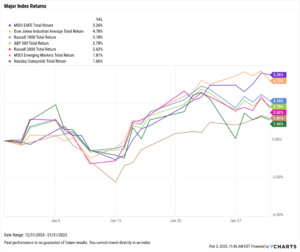
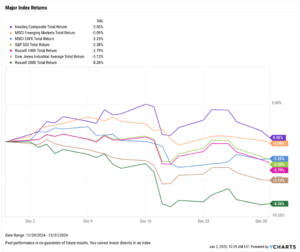
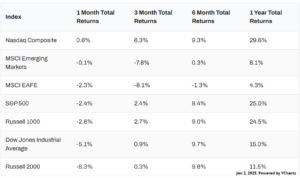
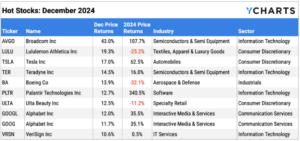
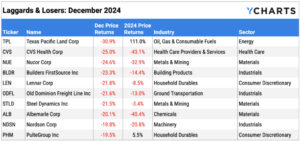
Equities posted mixed results in December to close out 2024. The price-weighted Dow Jones Industrial Average sank 5.1% as UnitedHealth Group (UNH), Sherwin-Williams (SHW), and Caterpillar (CAT) all posted double-digit declines in December. The market cap-weighted S&P 500 fell 2.4% and the Nasdaq Composite rose 0.6%. Small-caps had a particularly tough end to the year, as the Russell 2000 tumbled 8.3% in December.
Nonetheless, all three major US indices had a formidable 2024. The Dow rose 12.9%, the S&P 500 advanced 23.3%, and the Nasdaq surged 28.6%.
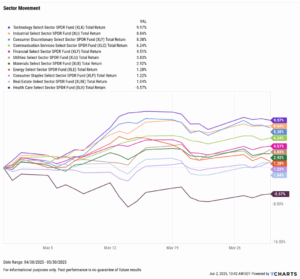
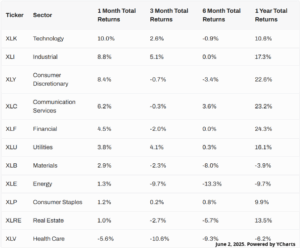
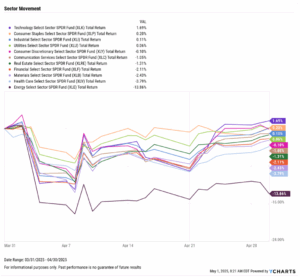
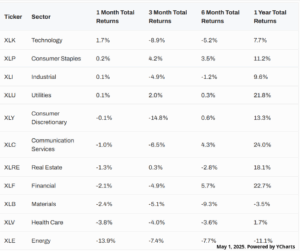
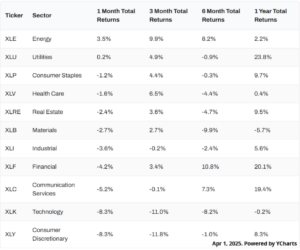
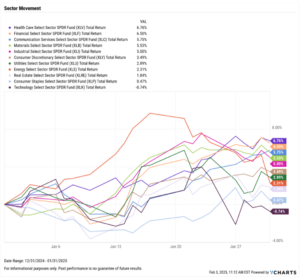
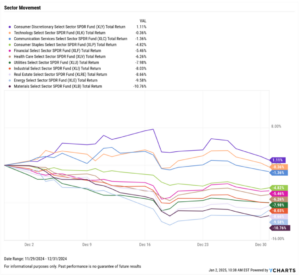
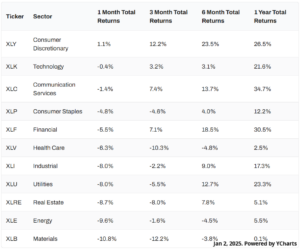
Only one sector had a positive December—Consumer Discretionary, which gained 1.1%. The worst-performing sector in December was Materials, which plummeted 10.8%.
The Federal Reserve cut its key interest rate by 25 basis points, bringing the current target range down to 4.25%-4.50%. Core inflation remained between 3.31% and 3.33% across all three prints between September and November. The prices of gold and major cryptocurrencies Bitcoin and Ethereum all fell lower in December to cap off what was a very positive 2024 for all three.
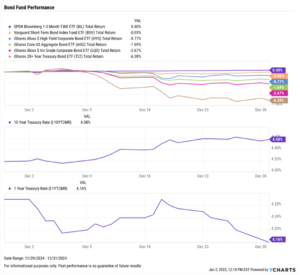
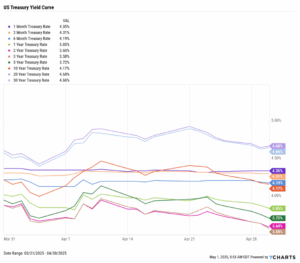
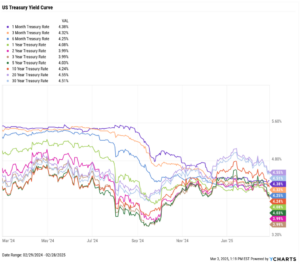
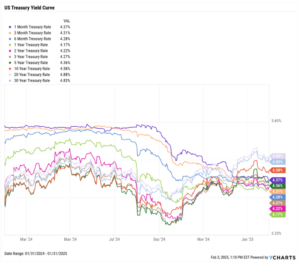
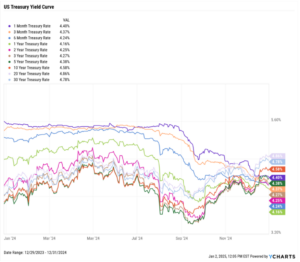
Short-term treasury yields fell following the Fed’s December 18th rate cut, while longer-term yields climbed higher. The 1-month fell by 36 basis points while the 30-year rose by 42 basis points at the opposite end of the curve.
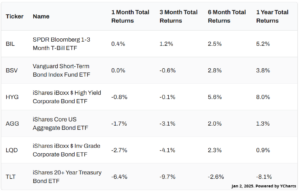
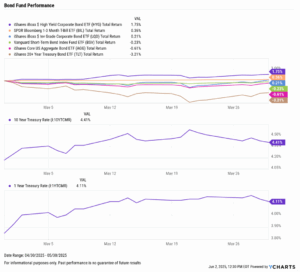
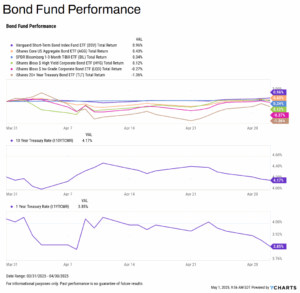
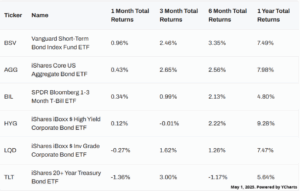
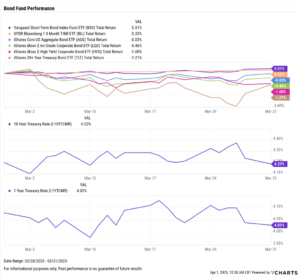
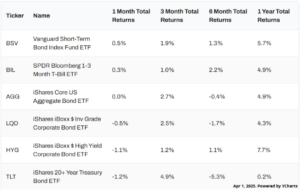
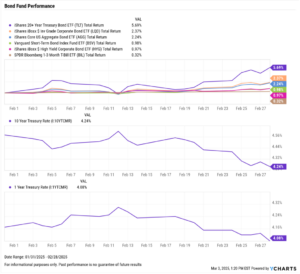
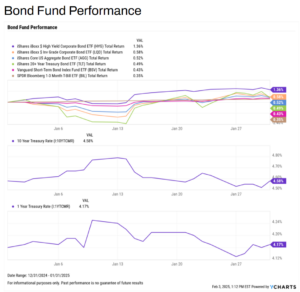
Bond funds also posted a mixed December as a result of the mixed yield movement. The SPDR Bloomberg 1-3 Month T-Bill ETF (BIL) added 0.4%, while the iShares 20+ Year Treasury Bond ETF (TLT) sank 6.4%.
Chappell Wealth Watch! Top Performers of 2024
Another year has come and gone. With 2024 now in the rearview mirror, what were the year’s best performers?
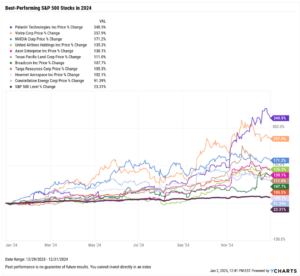
These were the ten best-performing S&P 500 stocks in 2024:
Palantir Technologies Inc (PLTR): 340.5%
Vistra Corp (VST): 257.9%
NVIDIA Corp (NVDA): 171.2%
United Airlines Holdings Inc (UAL): 135.3%
Axon Enterprise Inc (AXON): 130.1%
Texas Pacific Land Corp (TPL): 111.0%
Broadcom Inc (AVGO): 107.7%
Targa Resources Corp (TRGP): 105.5%
Howmet Aerospace Inc (HWM): 102.1%
Constellation Energy Corp (CEG): 91.4%
For the best-performing stocks of last year within the Dow Jones Industrial Average, Nasdaq-100, Russell 1000, and Russell 2000 indices, check out our recent blog post on The Best Performing Stocks of 2024.
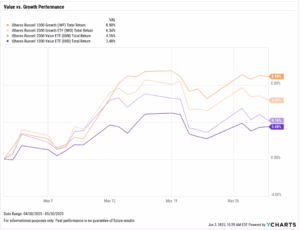
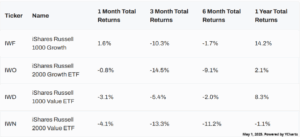
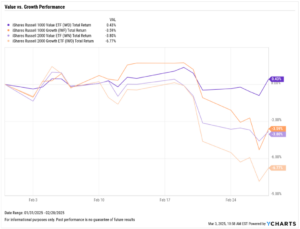
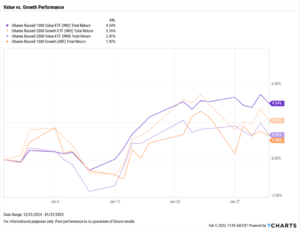
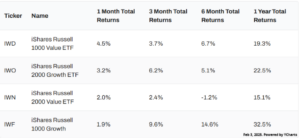
Value vs. Growth Performance

US Sector Movement
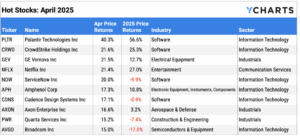
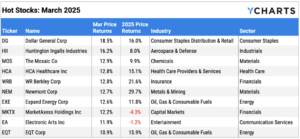
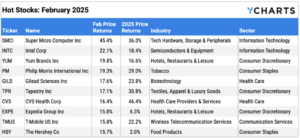
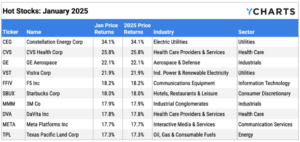
Top 10 S&P 500 Performers of December 2024
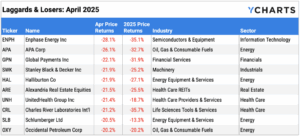
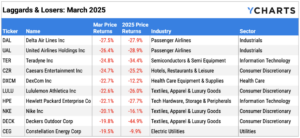
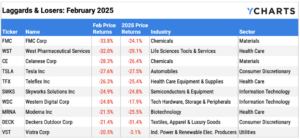
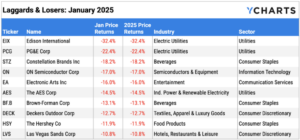
10 Worst S&P 500 Performers of December 2024
Economic Data Overview: Fed Cuts Interest Rate by a Quarter Point, Inflation Remains Level
Employment
The unemployment rate ticked higher to 4.2% between October and November, and the labor force participation rate fell 0.1 percentage points to 62.5%. November nonfarm payroll data showed that the U.S. economy added 227,000 jobs this month, a rebound from October’s print of 36,000, which was the lowest monthly jobs figure since December 2020.
Consumers and Inflation
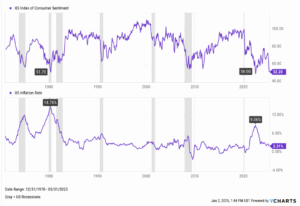
The US inflation rate inched higher to 2.75%, while core inflation was virtually unchanged at 3.33% for November. Core inflation YoY has remained rangebound between 3.31% and 3.33% over the last three months. The US Consumer Price Index rose 0.31% month over month, and US Personal Spending increased by 0.40%.
The Federal Reserve cut its key Fed Funds Rate by 25 basis points at the FOMC’s December 18th meeting. This lowered the Fed Funds Rate down to 4.25%-4.50% from 4.50%-4.75%, and marks the third rate cut since March 2020.
Production and Sales
The US ISM Manufacturing PMI rebounded by 1.9 points in November to 48.40, though the Services PMI dropped 3.9 points between October and November, bringing its latest reading down to 52.10. The YoY US Producer Price Index rose to 2.98% in November, while US Retail and Food Services Sales increased 0.69% between October and November.
Housing
US New Single-Family Home Sales rebounded with a 5.9% MoM increase in November after plummeting 14.8% in October, which was the largest monthly decline since July 2013. Existing Home Sales increased 4.8% MoM, marking its second consecutive monthly increase. The Median Sales Price of Existing Homes remained relatively unchanged month over month, as did mortgage rates. The 15-year Mortgage Rate ended December at 6.00%, while the 30-year settled slightly higher MoM at 6.85%.
Commodities
The price of gold shed another 1.3% in December, breaking further from its historic run higher and ending the month at $2,616.00 per ounce in US Dollars. Brent crude oil declined by 0.9% in December to $73.50 per barrel as of December 25th, while the price of WTI increased 3.1% to $70.38 per barrel as of December 26th. The average price of gas fell 4 cents MoM to $3.13 per gallon.
Fixed Income Performance: Insights into Bond ETFs & Treasury Yields
US Treasury Yield Curve
Bond Fund Performance
