June 2024 Market Summary: Equities Continue Higher, Rising Unemployment & Lower Treasury Yields
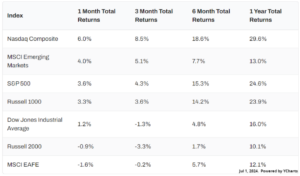
Equities continued their positive streak in June to close out the first half of the year. The Dow Jones Industrial Average edged 1.2% higher in June, the S&P 500 advanced 3.6%, and the NASDAQ surged 6%. It was a much better month for large-caps; the Russell 1000 index gained 3.3% while the small-cap Russell 2000 index lost 0.9%.
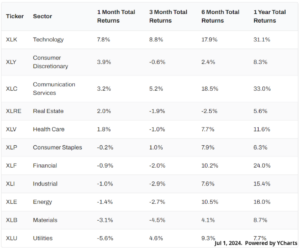
Despite the broad index gains, only five of the eleven sectors contributed to the positive month for equities. The gains were largely led by Technology’s 7.8% increase, followed by Consumer Discretionary at 3.9% and Communication Services at 3.2%. On the opposite side of the spectrum, Utilities went from first to worst with a 5.6% decline.
Unemployment topped 4% for the first month since January 2022, and the labor force participation rate fell to 62.5%. Both new and existing home sales slipped in June, yet the U.S. median existing home sales price set another all-time high. Inflation continues to hover at the lower end of the 3-4% range, while core inflation logged another monthly decline.
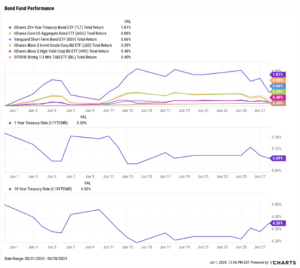
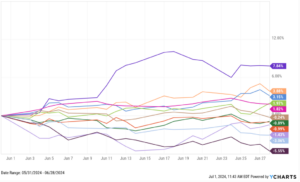
Treasury yields dropped across the board with the exception of the 3-month T-Bill. The 5-year Treasury note endured the largest decline on the curve for the second straight month, shedding another 19 basis points. T-Bill instruments saw minimal movement. For the third straight month, the 2-year, 3-year, 10-year, 20-year, and 30-year all decreased by double-digit basis points.
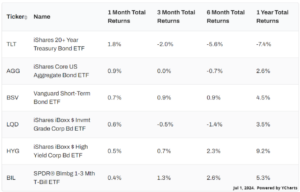
Bond funds benefitted from added gains as a result of the lower yields. The iShares 20+ Year Treasury Bond ETF (TLT) advanced 1.81%, the largest increase of any bond fund tracked on our chart.
Chappell Wealth Watch! 2024 Halftime Report
2024 is flying by, with the first of the year already in the books.
Long-equity investors have had a solid year so far. In the first six months of the year, 60% of S&P 500 constituents were positive, helping power the index higher by 14.5%.
Of the 303 positive S&P 500 constituents, some top performers in the first half of 2024 include:
- Super Micro Computer (SMCI), up 187%
- NVIDIA (NVDA), up 150%
- Carnival (CCL), which roared 24% higher in June alone to get back to even.
Of the 200 negative constituents, laggards in the first half of the year include:
- Walgreens Boots Alliance (WBA), down 54%
- Lululemon Athletica (LULU), down 42%
- Intel (INTC), down 38%.

Equity Performance: Stocks Edge Higher, Nasdaq Leads Way
Major Indexes

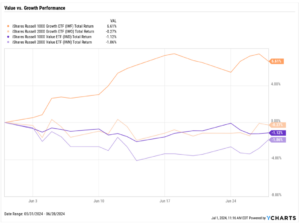
Value vs. Growth Performance

US Sector Movement
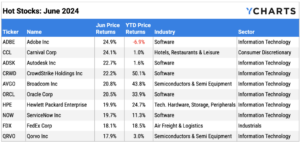
Top 10 S&P 500 Performer
10 Worst S&P 500 Performers

Economic Data Overview: Unemployment Tops 4%, New Home Sales Plummet while Prices Reach All-Time High
Employment
May’s unemployment rate reached 4% for the first time since January 2022. At the same time, labor force participation rate slipped 0.2 percentage points, down to 62.5%. Nonfarm payroll data showed 272,000 new jobs were added in May, a solid rebound from last month’s miss and surpassing economist expectations of 185,000 jobs.
Consumers and Inflation
May’s US inflation figure registered at 3.27%, a decline of under one-tenth of a percentage point and the eleventh consecutive month that YoY inflation has hovered in the 3 to 4 percent range. Core Inflation lowered to 3.42%, marking the 13th monthly decline in the last 14 months. The US Consumer Price Index was flat MoM, and US Personal Spending rose a quarter of a percent. The Federal Reserve held its key Fed Funds Rate at 5.50% at its June 12th, 2024 meeting, marking the seventh consecutive meeting in which the Fed left rates unchanged.
Production and Sales
The US ISM Manufacturing PMI stayed in contraction territory for the third straight month, slipping another 0.2 points in June to 48.50. The YoY US Producer Price Index for May was 2.24%, the second consecutive month above 2% since April 2023, while April US Retail and Food Services Sales were up 0.09% MoM.
Housing
US New Single-Family Home Sales plummeted 11.3% in May, while US Existing Home Sales were down a much lighter 0.7% MoM. Despite the overall contraction in housing demand, the Median Sales Price of Existing Homes rose another 3.1% and set a new all time high of $419,300. Mortgage rates fell for the second straight month; as of June 27th, the 15-year Mortgage Rate lowered to 6.16% and the 30-year clocked in at 6.86%.
Commodities
The price of Gold traded sideways in June, falling slightly MoM to $2,330.90 per ounce as of June 28th. Crude oil prices surged higher this month; as of June 24th, the price of Brent increased 9.1% to $86.75 per barrel. Despite rising oil prices, the average price of gas fell 14 cents to $3.56 per gallon.
Fixed Income Performance: Insights into Bond ETFs & Treasury Yields
US Treasury Yield Curve

Bond Fund Performance