August 2024 Market Summary: Equities Claw Back Losses, Softness in the Labor Market, and Falling Treasury Yields
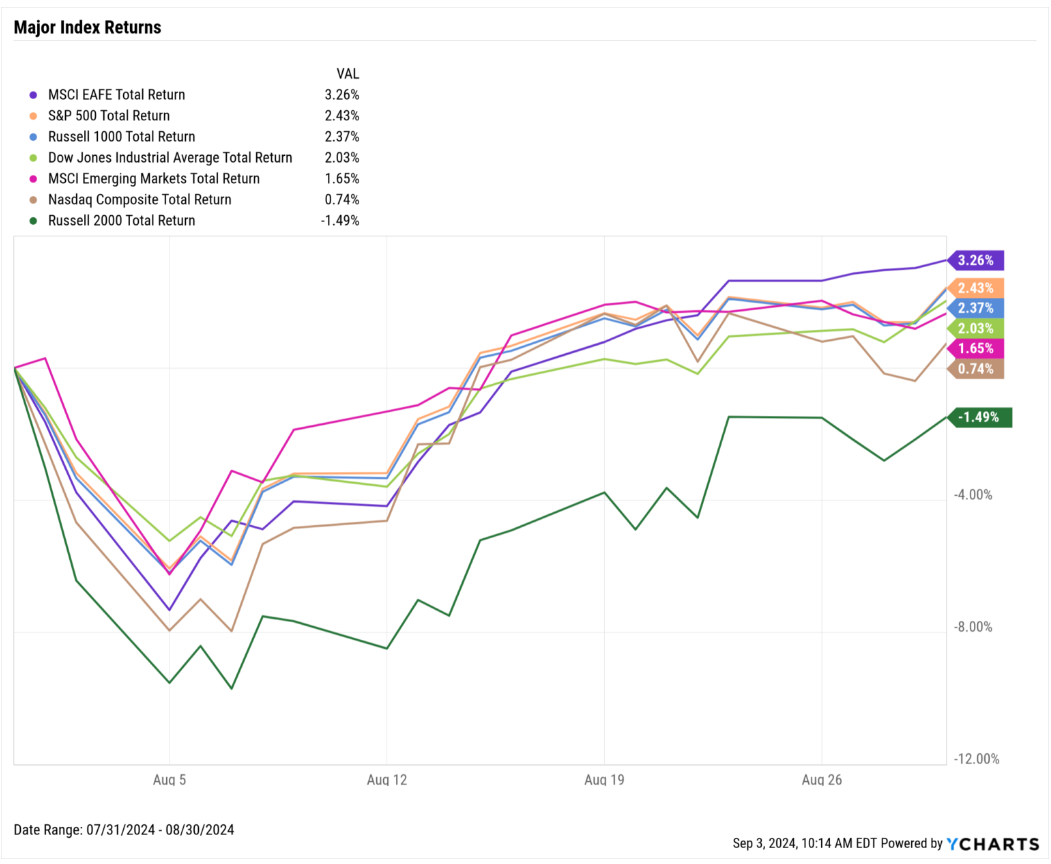
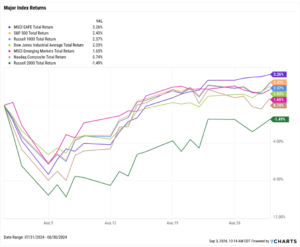
The equity pullback continued into the first week of August but most indices regained a substantial amount of their losses by month’s end. The S&P 500 rose 2.4% in August, the Dow Jones Industrial Average advanced2%, and the Nasdaq Composite added 0.7%. The one laggard on our chart (below)was the small-cap Russell 2000 index which, after surging 10.2% in July, retreated 1.5% in August.
On a percent-off-high basis, the S&P 500 ended August just 0.3% away from a new all-time high, while the Dow Jones has fully regained its losses. The Nasdaq Composite remains 5% below its all-time high, but has come a long way from as much as a 13.1% drawdown earlier this month.
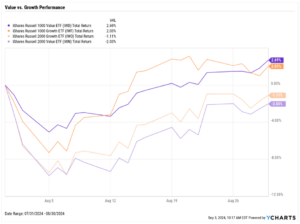
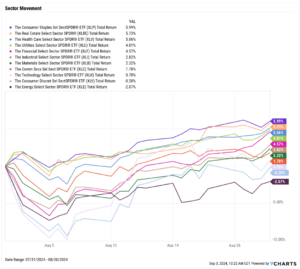
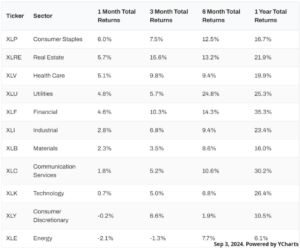
Just two of the eleven sectors finished August in the red: Consumer Discretionary, which fell 0.2%, and Energy, which gave up 2.1%. The rotation into Value stocks gained momentum as Consumer Staples, Real Estate, and Health Care all posted gains of over 5% in August. Utilities and Financials were not far behind, advancing 4.8% and 4.6% in the month, respectively.
The labor market showed signs of cooling as the July nonfarm payrolls figure of 114,000 fell short of expectations and the unemployment rate rose for the fourth straight month to 4.3%, triggering the “Sahm Rule”. Gold broke through $2,500 per ounce for the first time, even as the inflation rate fell further below 3%. Home sales–both new and existing–rebounded on a month-over-month basis, while mortgage rates fell following hints of a Fed Funds Rate cut taking place at the next FOMC meeting.
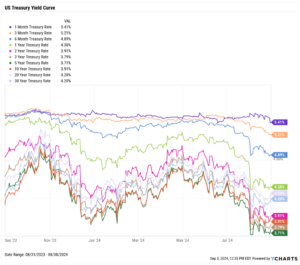
Treasuries repeated their activity patterns from July: yields declined across the board and the middle of the curve posted the largest MoM declines. The 1-year T-Bill and 2-year note logged the largest yield declines, shedding 35 and 38 basis points, respectively.
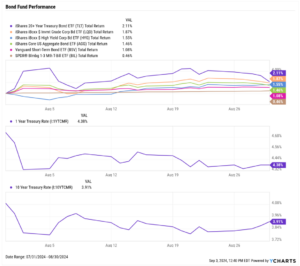
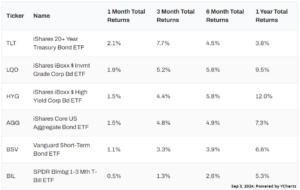
Bond funds added further gains due to declining yields. The iShares 20+ Year Treasury Bond ETF (TLT) advanced 2.1% and the iShares iBoxx Investment Grade Corporate Bond ETF (LQD) rose 1.9%, the largest increases of bond funds tracked on our chart (below).
Chappell Wealth Watch! Bracing for Election Year Fear
The 2024 presidential election is just two months away. How much should advisors prepare to address client concerns about how their investments might be affected by various election outcomes?
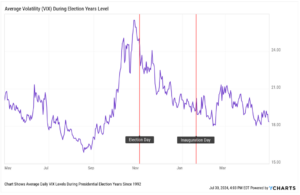
In our advisor’s guide to the elections, ”How Do Presidential Elections Impact The Market?“, we constructed this chart using daily average CBOE Volatility Index (VIX) values from the last eight presidential election cycles since 1992 and found that the “fear index” tends to spike starting in September and continuing up to Election Day. However, things generally cool down after the election and in the roughly two-month period leading up to Inauguration Day.
Though advisors might brace themselves for an uptick in client anxiety over the next couple of months, such storms tend to pass once the election is over.
Equity Performance: Stocks Stage Comeback After Early August Meltdown
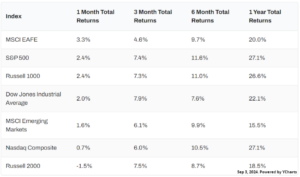
Major Indexes
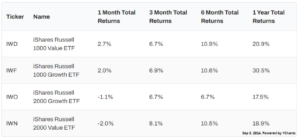
Value vs. Growth Performance
US Sector Movement
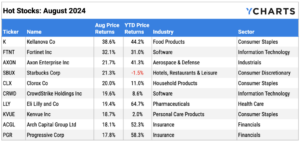
Top 10 S&P 500 Performers of August 2024
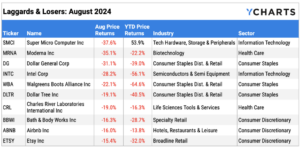
10 Worst S&P 500 Performers of August 2024
Economic Data Overview: Unemployment Rises as Job Growth Slows, Gold Breaches $2,500
Employment
The unemployment rate rose to 4.3% in July, marking the fourth straight monthly increase. According to the latest nonfarm payroll data, 114,000 jobs were added in July, falling short of the expected 175,000 and marking the second-fewest monthly job gains since December 2020.
The unemployment rate dominated financial headlines in August because its rise of 0.5 percentage points from its 12-month low of 3.8% triggered the “Sahm Rule”, which serves as an early warning sign of a possible recession. However, the rise in unemployment and weaker-than-expected job gains come as the labor force participation rate rose to 62.7% in July, making economists assess if things will be different this time.
Consumers and Inflation
The US inflation rate dove further below 3%, setting at 2.89% in July; core Inflation came in at 3.17%, declining for the 15th month out of the last 16. The US Consumer Price Index rose 0.15% MoM, and US Personal Spending MoM surged a half percent higher. The Federal Reserve held its key Fed Funds Rate at 5.50% for the eighth consecutive meeting on July 31st, 2024; however, markets are expecting a rate cut at the next FOMC meeting on September 18th.
Production and Sales
The US ISM Manufacturing PMI inched higher by 0.4 points to 47.20 in July, but remains in contraction territory with a reading below 50. Services, on the other hand, rebounded 2.6 points in July to 51.40 following a five-point drop in June, signaling positive expansion. The YoY US Producer Price Index fell to 2.25% in July, bucking a streak of five consecutive monthly increases. Lastly, US Retail and Food Services Sales MoM jumped nearly 1%.
Housing
US New Single-Family Home Sales surged 10.6% MoM, and Existing Home Sales increased 1.3% MoM. The Median Sales Price of Existing Homes retreated from its all-time high by 1% to $422,600 at the end of July. Mortgage rates continued to fall as hints of a September rate cut rippled through markets; the 15-year Mortgage Rate tumbled 48 basis points in August to 5.51% while the 30-year slipped 38 basis points to 6.35%, both as of August 29th.
Commodities
The price of Gold in August reached $2,500 per ounce for the first time ever, settling at $2,513.40 as of August 30th. Crude oil prices traded sideways in August; the price of WTI settled at $78.40 per barrel as of August 26th, slightly below its closing price in July of $79.36. The spot price of Brent was $80.34 per barrel as of August 23rd, down from its end-of-July level of $81.39. The average price of gas plummeted 17 cents in August to $3.43 per gallon as of August 26th.
Fixed Income Performance: Insights into Bond ETFs & Treasury Yields
US Treasury Yield Curve
Bond Fund Performance