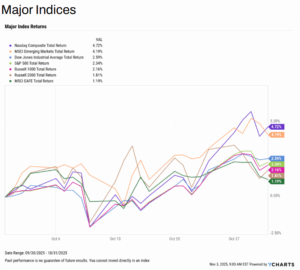
Market Summary: Tech Leads While Materials Lag, All Indices Positive as the Fed Cuts Rates Again
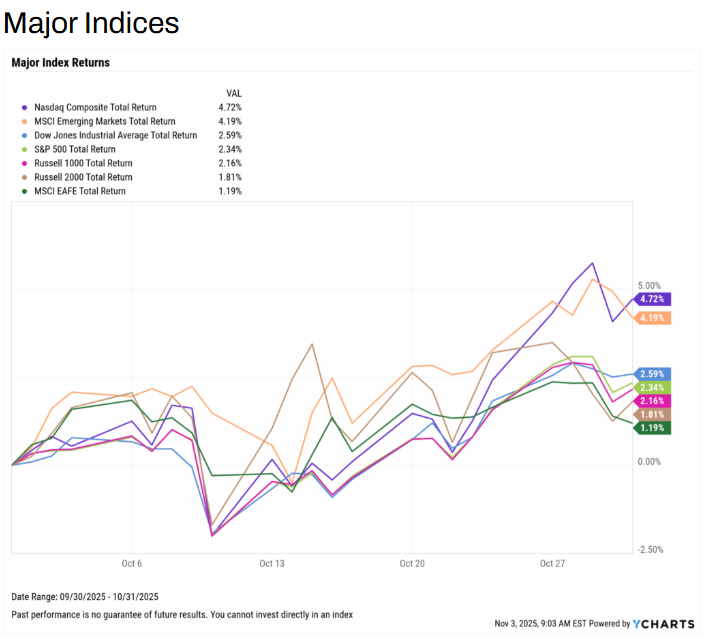
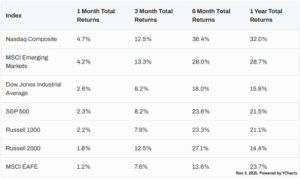
Markets moved higher across the board for the second straight month, as the S&P 500 posted a gain of 2.3%. This advance was led by the Nasdaq and emerging markets, which increased by 4.7% and 4.2% respectively. October’s broad-based gains reflect continued investor confidence, as the Fed cut interest rates by 25 basis points for the second consecutive month.
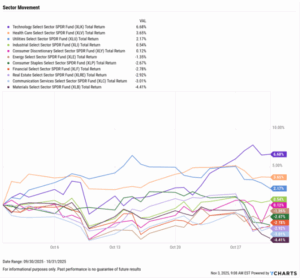
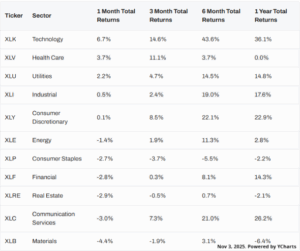
Sector performance was split in October as Technology led the way with another near-7% month. Communication, Real Estate, and Financials were all negative, though none worse than Materials, which slipped 4.4% for the month.
The ongoing government shutdown delayed several key economic releases, limiting visibility into the broader economy. With labor and select inflation reports postponed, the Fed Funds Rate 25 basis point rate cut to a target range of 3.75%–4.00% remains the most significant policy development.
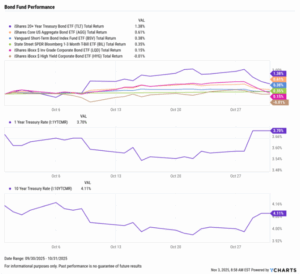
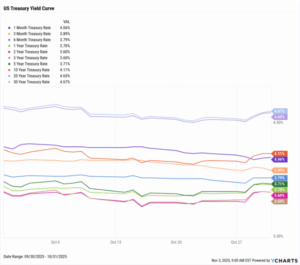
Treasury yields declined across most of the curve in October, with the 1-year serving as the lone outlier to have increased. The largest decline came from the 1-month Treasury, down 14 basis points to 4.06%, followed by the 3-month, which fell slightly less, by 13 basis points to 3.89%.
Chappell Wealth Watch! Nvidia Overtakes Entire Nations
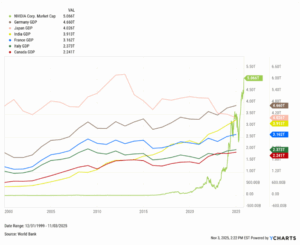
Nvidia (NVDA) has officially entered uncharted territory. The company’s market capitalization has surged past $5 trillion, making it larger than the entire GDP of every country globally except the United States and China. At this scale, Nvidia alone is worth more than two Canadas and rivals the combined economies of Italy and France.
Its rise, up 28,900% over the past decade, has reshaped modern markets. Nvidia now accounts for 8.5% of the entire S&P 500 Index, an extraordinary level of concentration for a single stock. Once a leading indicator of innovation, the company has become a measure of market sentiment itself, driving major index performance and portfolio returns alike.
With earnings set for November 19th, the stock currently trades at a P/E ratio of 59, leaving investors eager to see whether results can sustain a valuation rivaling that of entire nations. The comparison highlights both the power and potential imbalance of today’s equity landscape, one that advisors can explore, visualize, and contextualize directly in YCharts.
Equity Performance: Technology Pushes Higher While Materials Lag, All Major Indices Positive in October
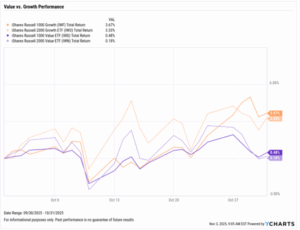
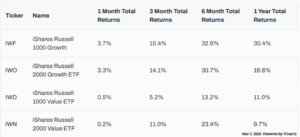
Value vs. Growth Performance
US Sector Movement
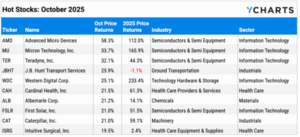
Top 10 S&P 500 of October 2025
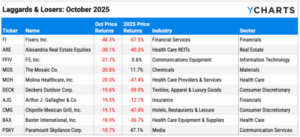
10 Worst S&P 500 Performers of October 2025
Economic Data Overview: Softening Labor Market Key to Fed Rate Cut, Housing Market Shows Signs of Recovery

Employment
With September’s employment report delayed by the ongoing government shutdown, official labor data remains limited. The most recent release from August showed unemployment at 4.3%, reflecting a gradually cooling job market.
Advisors can continue tracking labor conditions in YCharts using alternative datasets that remain available throughout the shutdown. ADP Employment Change and ADP Private Employment provide monthly updates on private-sector payroll growth, while the Challenger Report highlights announced layoffs and sector-level shifts. For additional context, LinkedIn’s Jobs Report offers a broader view of hiring activity and workforce trends.
Consumers and Inflation
The US inflation rate rose to 3.01% in September, though core inflation fell to 3.02%. The US Consumer Price Index sits at 0.3% MoM, and US Personal Spending went unreported as a result of the government shutdown.
At the October 29th FOMC meeting, the Federal Reserve cut its key Fed Funds Rate target range by another 25 basis points to 3.75%-4.00%. Fed Chair Powell stated that “job creation is pretty close to zero”, and that a further rate cut in December is “not a foregone conclusion, far from it”. The FedWatch tool still assumes over a 68% chance of a third straight cut when the FOMC meets next on December 10th.
Production and Sales
The US ISM Manufacturing PMI increased 0.4 points in September to 49.1, its second monthly increase in a row. The Services PMI fell by 2.0 points to 50.0, sitting directly on the line between expansion and contraction. The YoY US Producer Price Index and US Retail and Food Services Sales both went unreleased due to the government shutdown.
Housing
Existing Home Sales increased by 1.5% MoM in September, and the Median Sales Price of Existing Homes fell for the third month in a row by 1.7%, with prices sitting at $415,200. Mortgage rates declined throughout October, with the 15-year Mortgage Rate at 5.41% and the 30-year at 6.17% to end the month.
While US New Single-Family Home Sales were unreported, the NAHB Housing Market Index can be used to measure homebuilder confidence, providing an early indication of construction sentiment and future building activity.
Commodities
The price of gold increased slightly this month by 1.8% following a record-setting September, leaving SPDR Gold Shares ETF (GLD) at $368.12 per share. Oil prices decreased, with Brent crude down 4.4% for the month to $65.52 per barrel. WTI was down by 1.7% to $62.13.
Fixed Income Performance: Insights into Bond ETFs & Treasury Yields
US Treasury Yield Curve
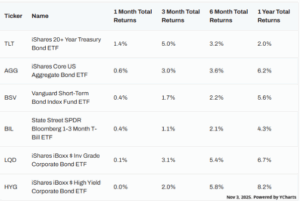
Bond Fund Performance