July 2024 Market Summary: Rotation into Value, Cooling Inflation, and Falling Treasury Yields
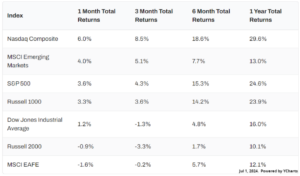
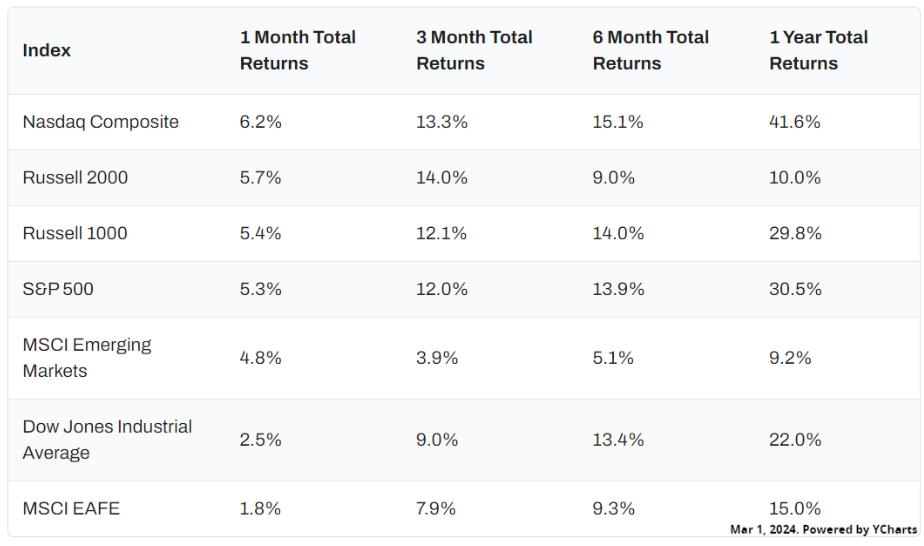
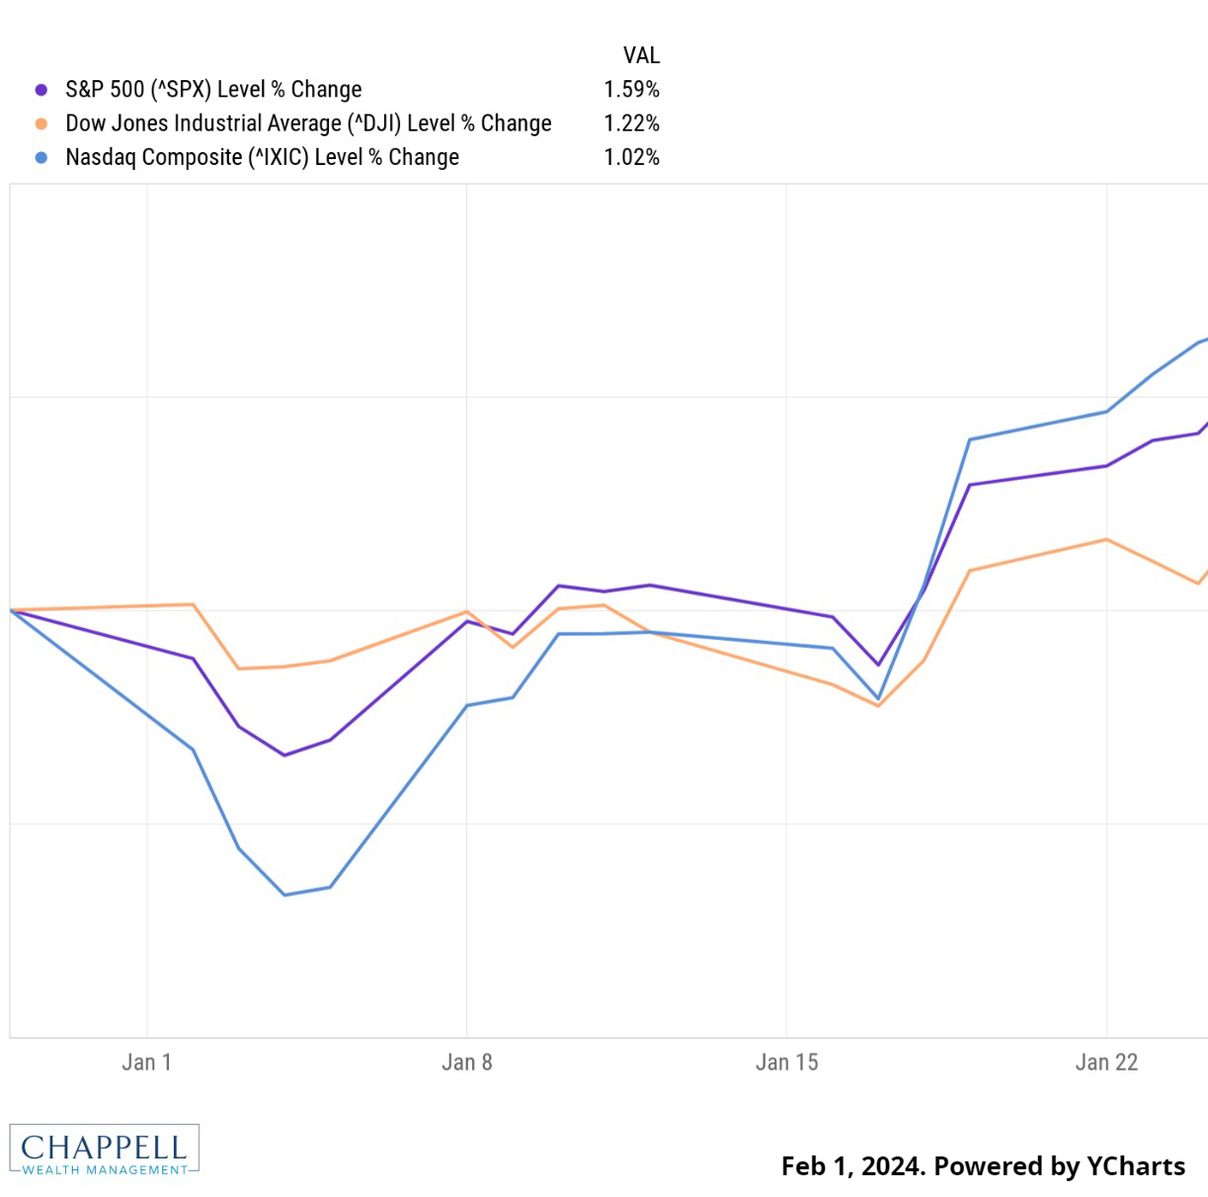
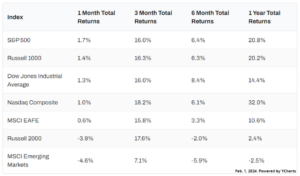
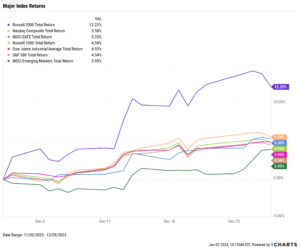
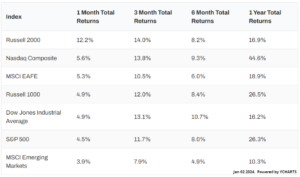
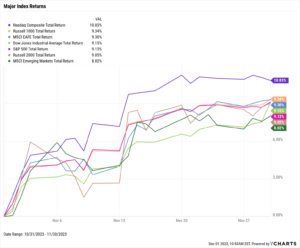
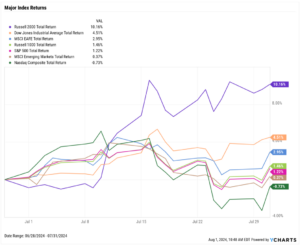
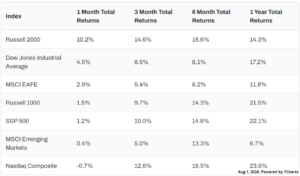
Equities experienced some turbulence in the second half of July but most indices finished higher thanks to a solid first half of the month. The Dow Jones Industrial Average rose 4.5% higher in June, the S&P 500 advanced 1.2%, and the NASDAQ slipped 0.7%. July was a stellar month for small-caps, as the small-cap Russell 2000 index surged 10.2%.
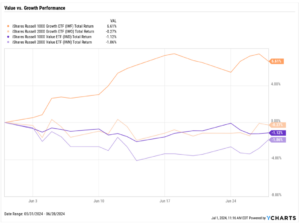
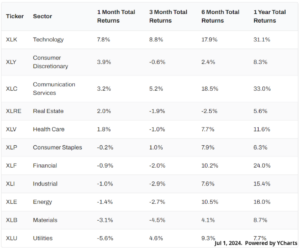
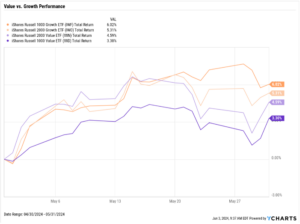
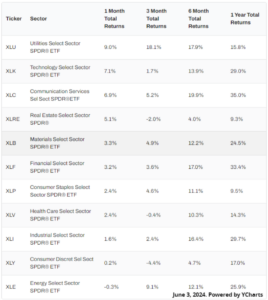
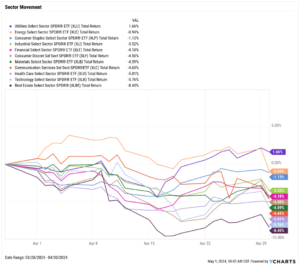
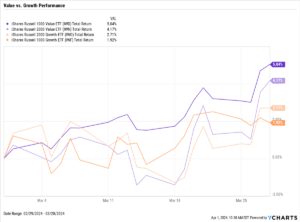
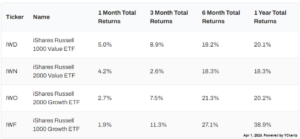
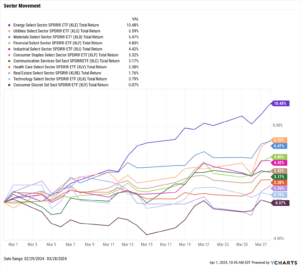
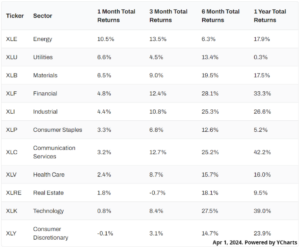
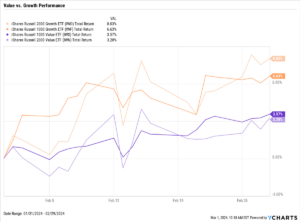
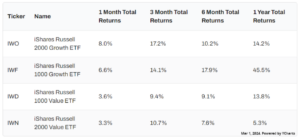
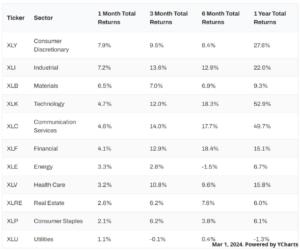
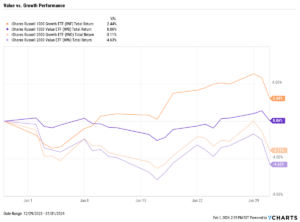
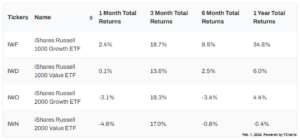
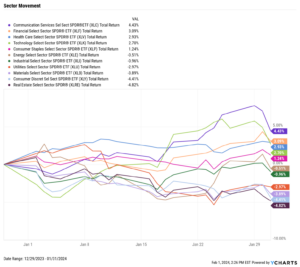
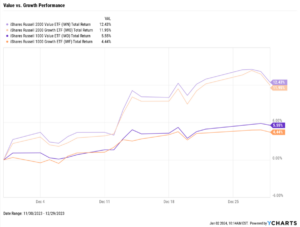
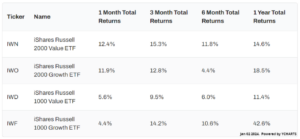
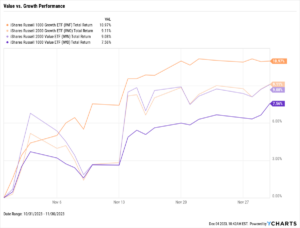
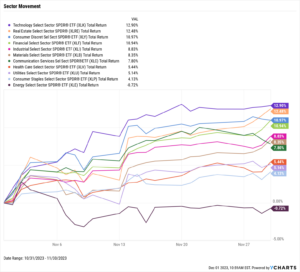
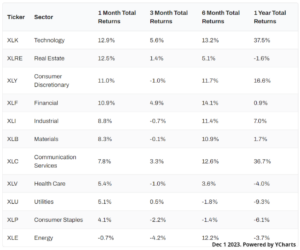
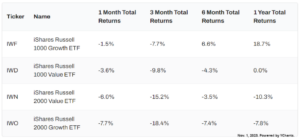
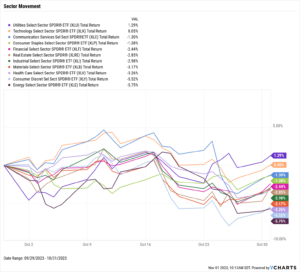
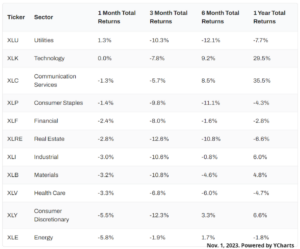
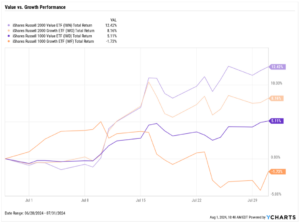
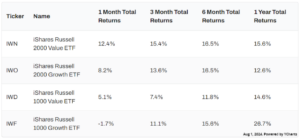
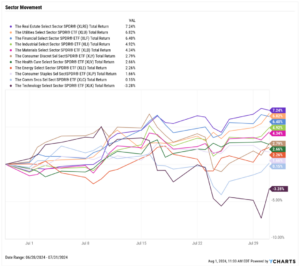
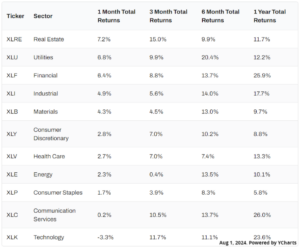
Only one of the eleven sectors finished July in the red: Technology, which fell 3.3%. Value stocks were the star of the show in July as investors rotated out of growth and tech names. Both small and large-cap value equity styles performed better than their growth counterparts. The top three sectors in July were value-oriented sectors: Real Estate, Utilities, and Financials, which posted respective gains of 7.2%, 6.8%, and 6.4%.
Inflation fell below 3% for the first time since June 2023, breaking through the 3-4% range it been hovering in for the last twelve months. Unemployment rose for the third straight month, though labor force participation rose and job growth continued to remain relatively stable even in a high interest rate environment. Both new and existing home sales fell again in July reports as the U.S. median existing home sales price set another all-time high.
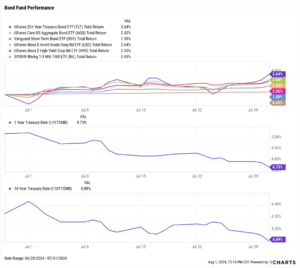
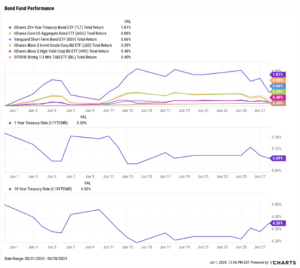
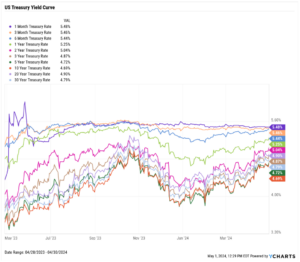
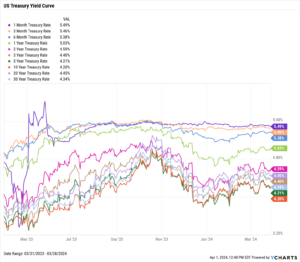
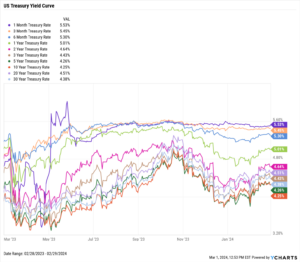
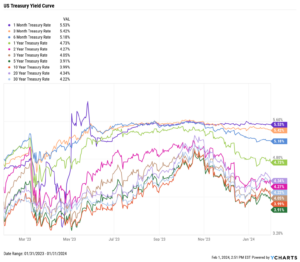
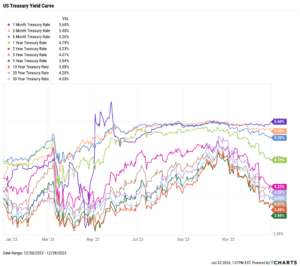
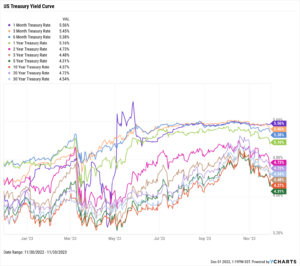
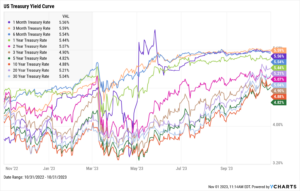
Treasury yields continued to fall with the middle of the curve posting the largest MoM declines. The 2-year and 3-year Treasury notes endured the largest decline on the curve; each duration shed 42 basis points in July, while both the 1-year and 5-year notes each fell 36 basis points.
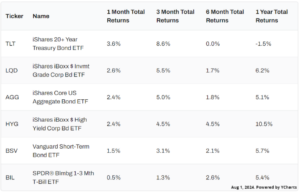
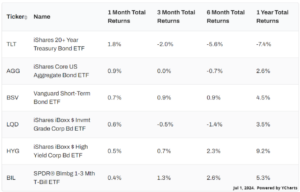
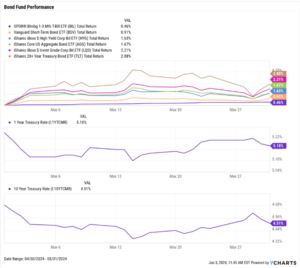
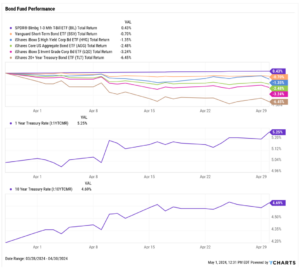
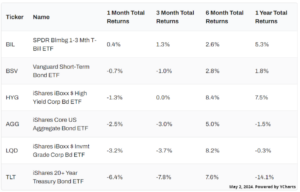
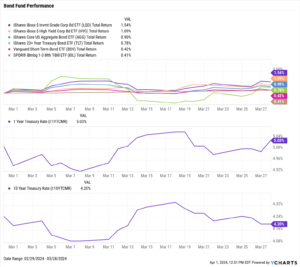
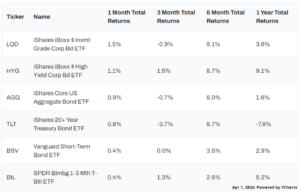
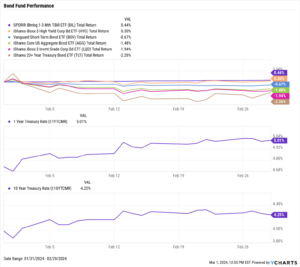
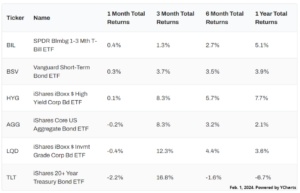
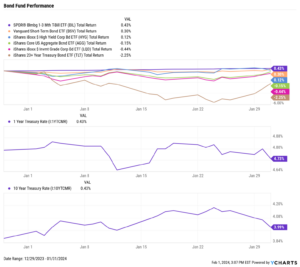
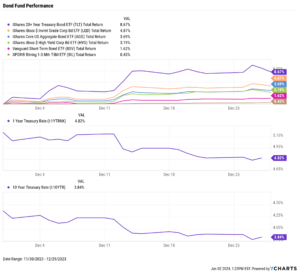
Bond funds benefitted from added gains as a result of the lower yields. The iShares 20+ Year Treasury Bond ETF (TLT) advanced 3.6% and the AGG rose 2.4%, the largest increases of any bond fund tracked on our chart (below).
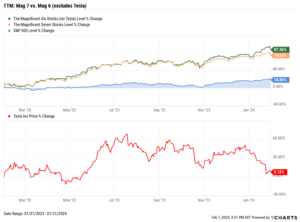
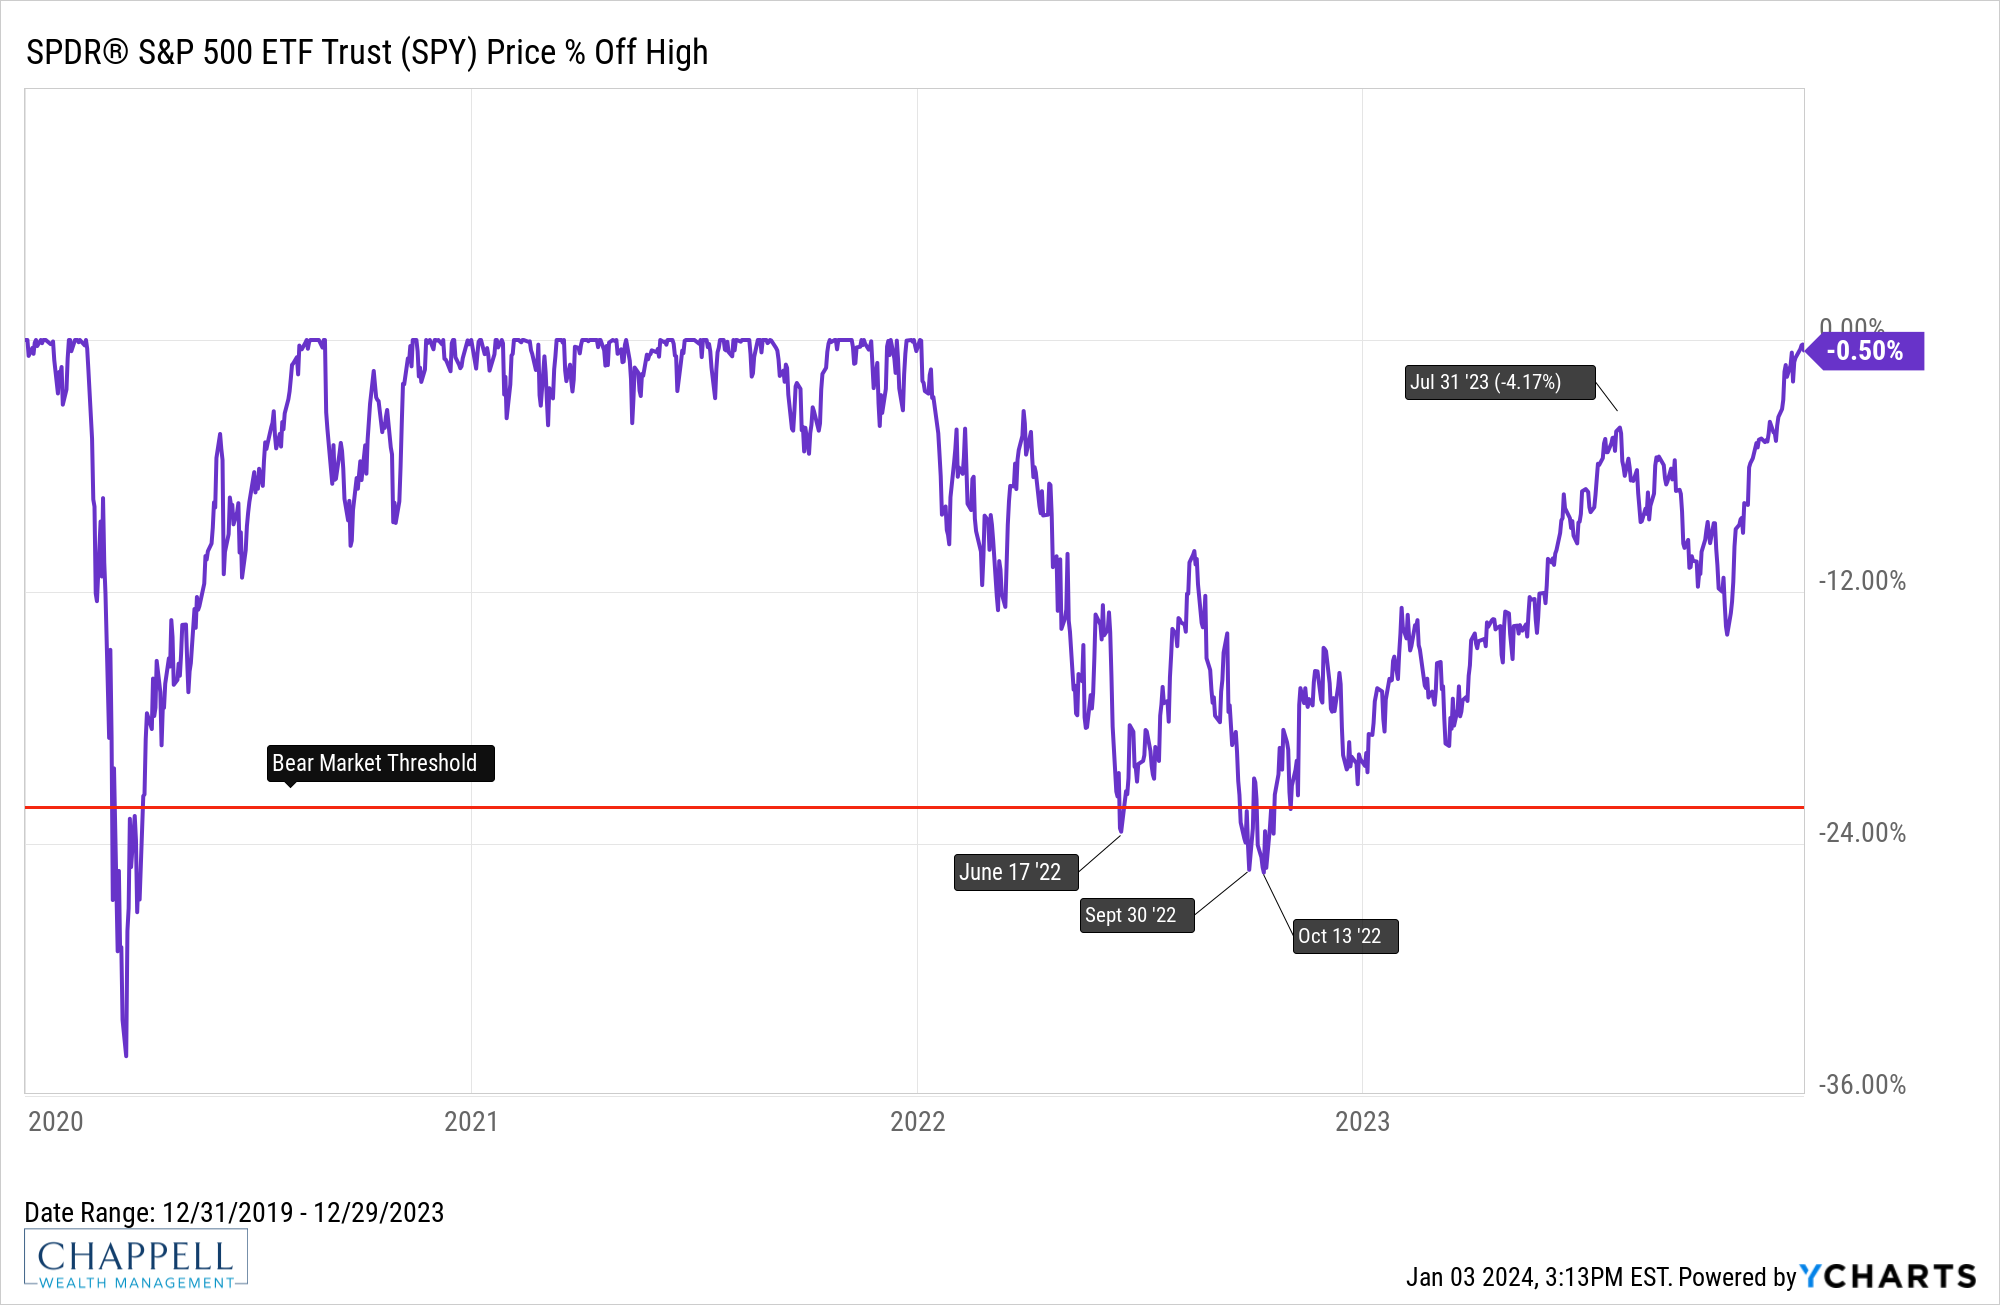
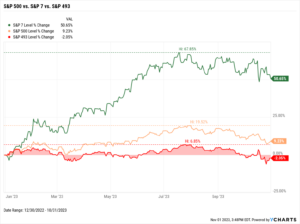
Chappell Wealth Watch! The Growth and Tech Sell-off Illustrated
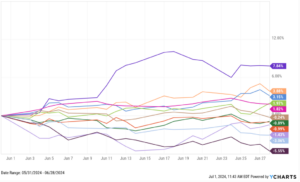
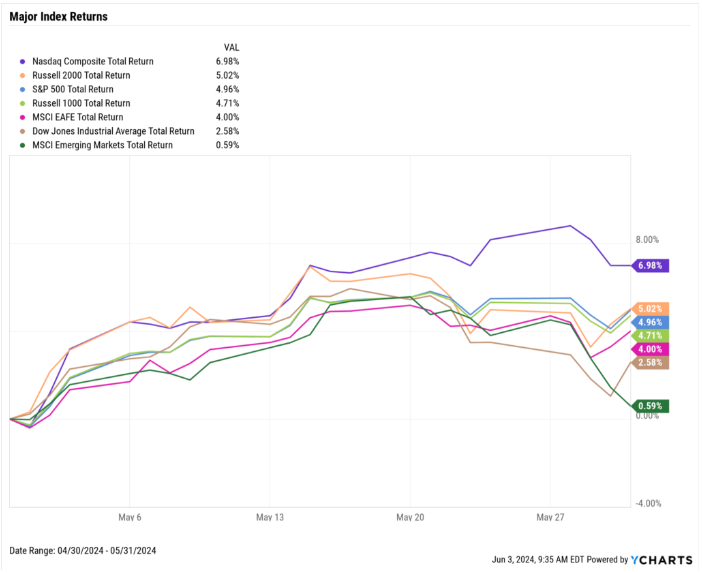
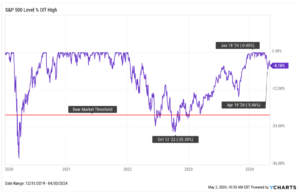
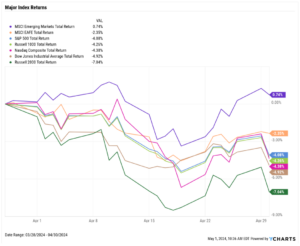
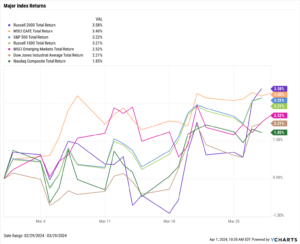
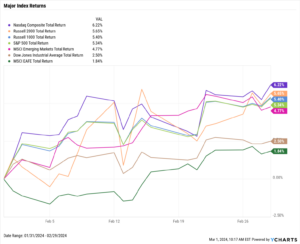
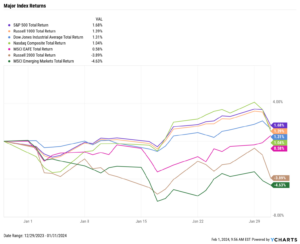
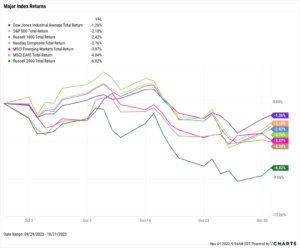
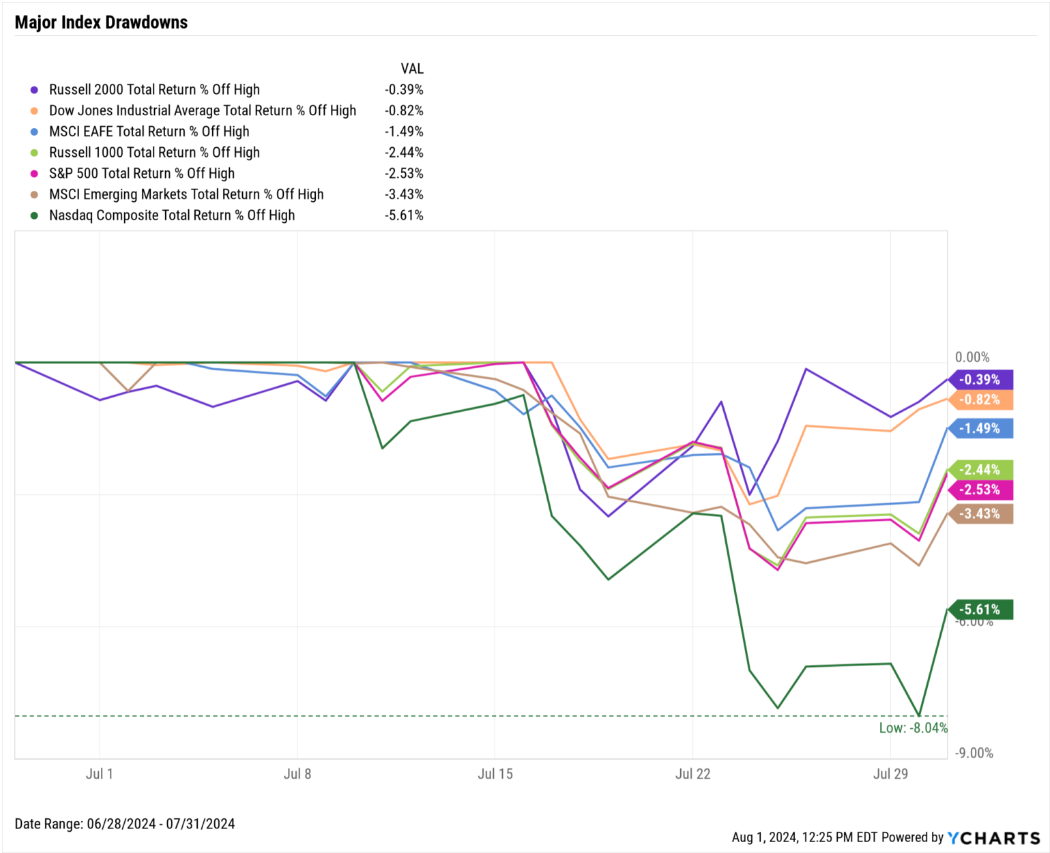
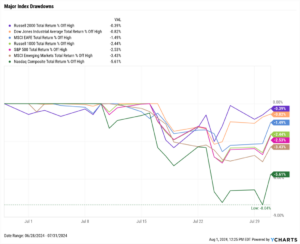
A major headline in July was the tech selloff as investors rotated out of mega-caps and other growth names. Below is the same visual as our “Major Index Return” chart in the “Equity Performance” section, but showing percent-off-high instead of returns.
The second half of July saw mild drawdowns across the indices tracked, but the selloff was especially noteworthy in the Nasdaq, which drifted as much as 8% from its all-time high.
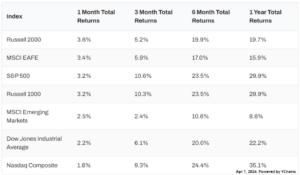
Equity Performance: Value & Small Cap Stocks Shine
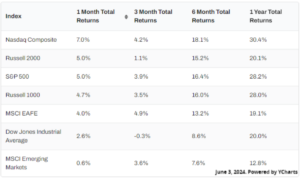
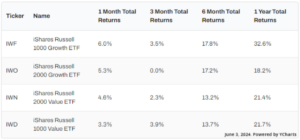
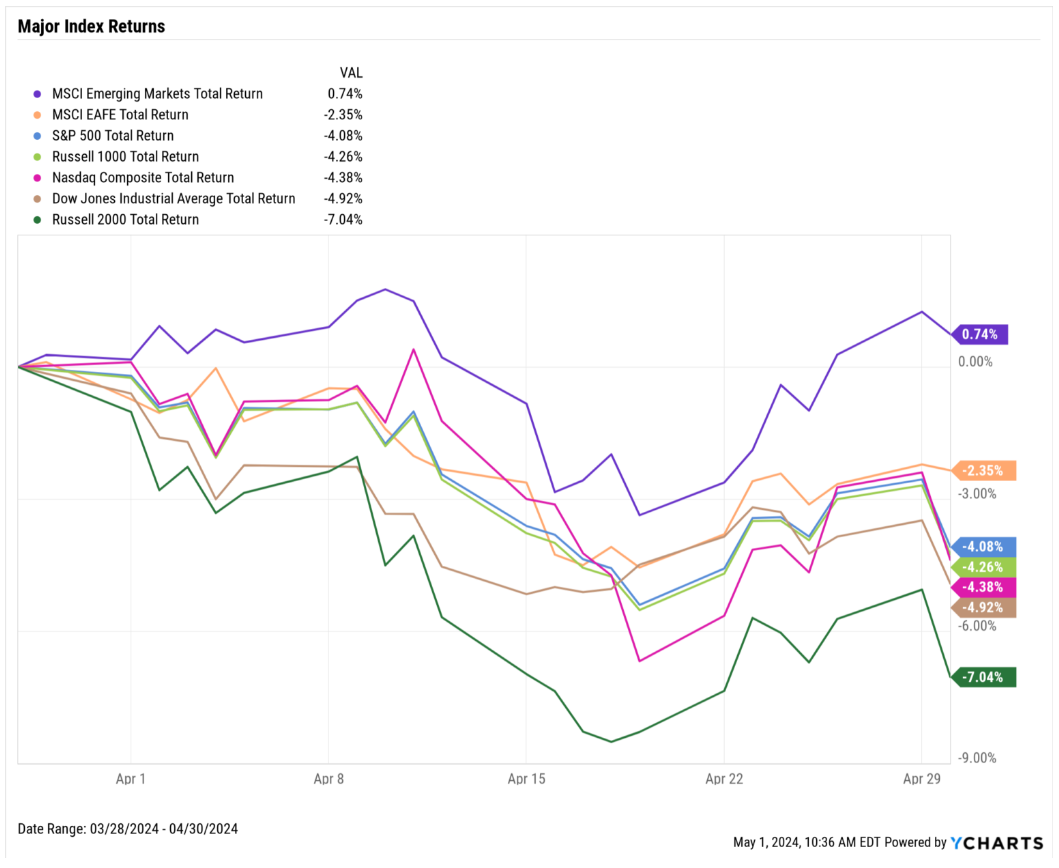
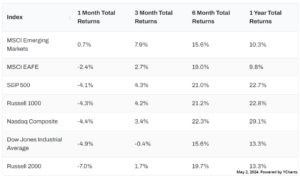
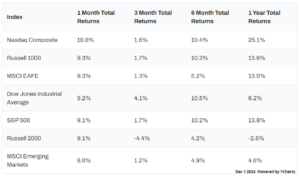
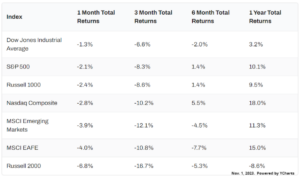
Major Indexes
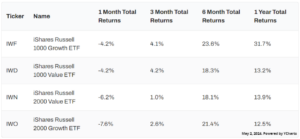
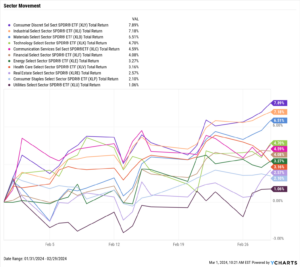
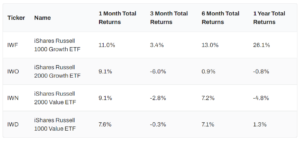
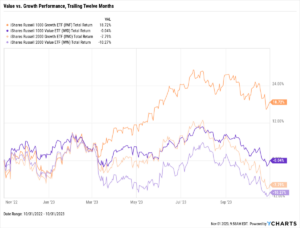
Value vs. Growth Performance
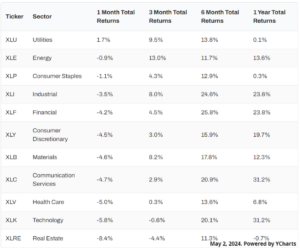
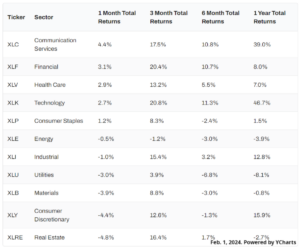
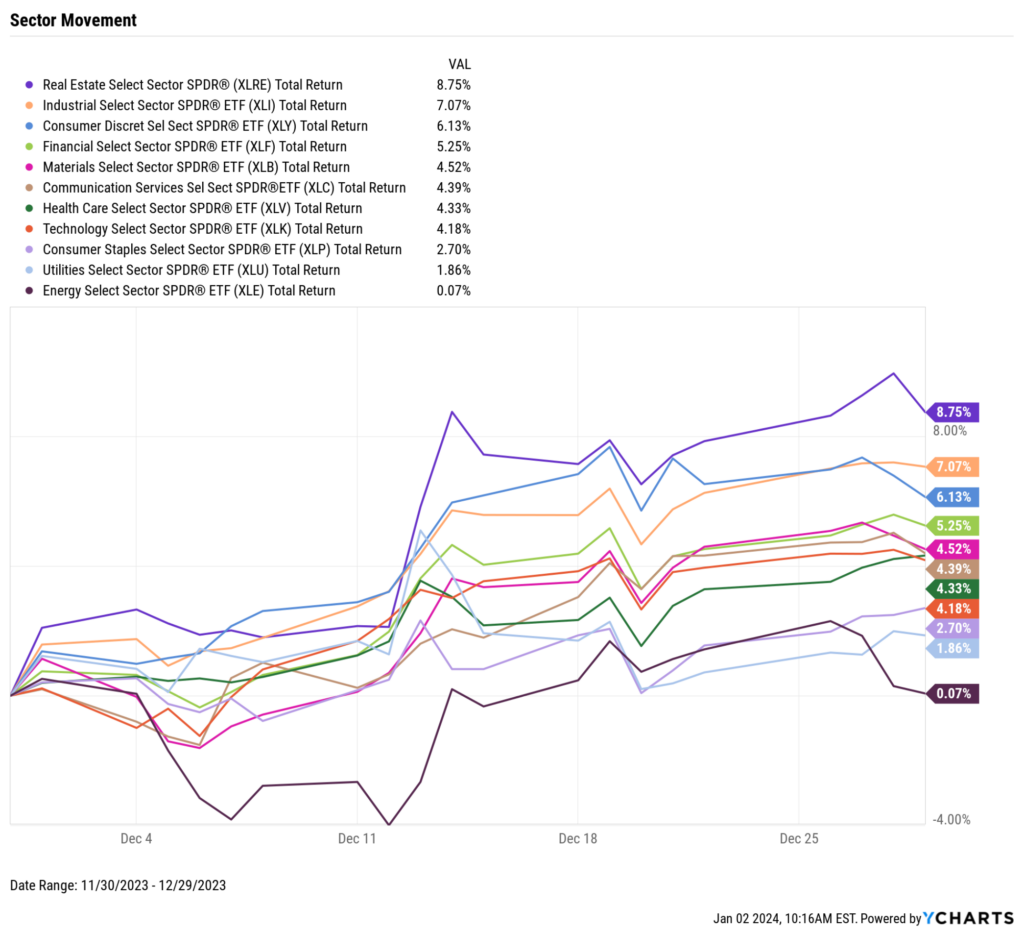
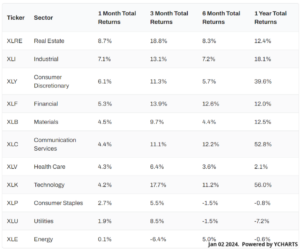
US Sector Movement
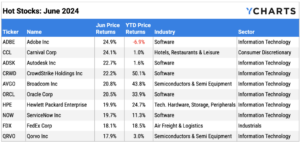
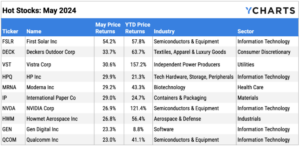
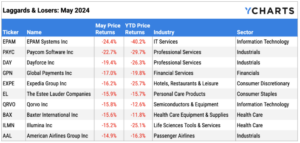
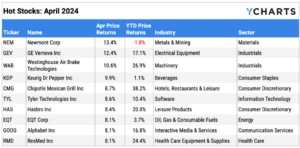
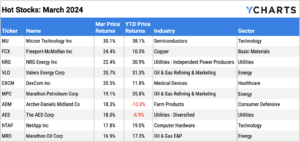
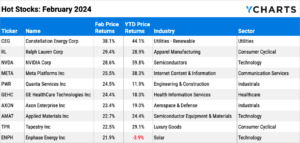
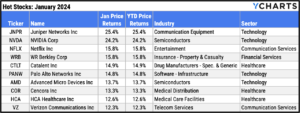
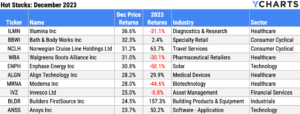
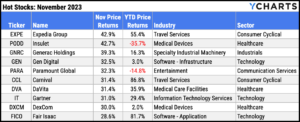
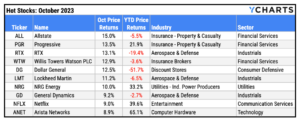
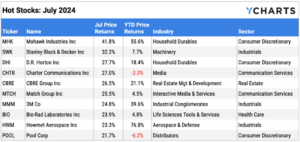
Top 10 S&P 500 Performers of July 2024
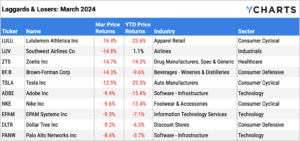
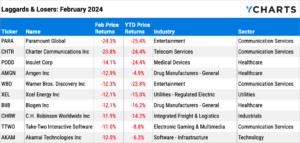
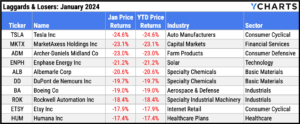
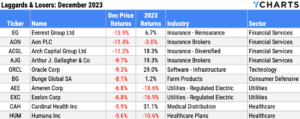
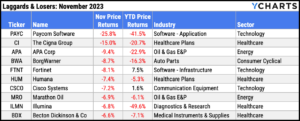
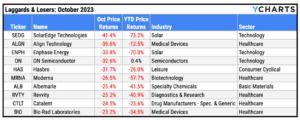
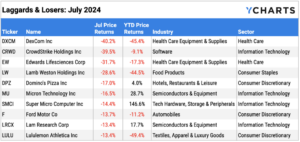
10 Worst S&P 500 Performers of July 2024
Economic Data Overview: Inflation Falls Below 3%, Home Sales Shrink while Prices Set Another All-time High
Employment
May’s unemployment rate ticked up for the third straight month to 4.1%. At the same time, the labor force participation rate rose 0.1 percentage points to 62.6%. 206,000 jobs were added in June according to the latest nonfarm payroll data, in-line with expectations and the sixth month out of the last seven in which the figure was above 200,000.
Consumers and Inflation
The inflation rate back in June 2023 registered at 2.97%. After spending the next eleven months above 3%, US inflation returned to 2.97% one year later in June 2024. Core Inflation fell for the 14th month out of the last 15, to 3.27% in June. The US Consumer Price Index was negative on a MoM basis for the first time since July 2022 and US Personal Spending rose three-tenths of a percent. The Federal Reserve held its key Fed Funds Rate at 5.50% at its July 31st, 2024 meeting, marking the eighth consecutive meeting in which the Fed left rates unchanged.
Production and Sales
The US ISM Manufacturing PMI dove further into contraction territory, slipping for the fourth straight month to 46.80. The YoY US Producer Price Index logged its fifth consecutive monthly increase, rising to 2.64% in June. US Retail and Food Services Sales MoM shrank by 0.02% in June.
Housing
US New Single-Family Home Sales MoM were down slightly in June following a nearly 15% plummet in May. MoM Existing Home Sales fared worse, falling 5.4% in June. Despite prolonged contraction in housing demand, the Median Sales Price of Existing Homes rose another 2.3% to set a new all time high of $426,900. Mortgage rates fell for the third straight month; as of July 25th, the 15-year Mortgage Rate slipped to 6.07% and the 30-year clocked in at 6.78%.
Commodities
The price of Gold broke above $2,400 for the first time ever in July before settling at $2,386.10 as of July 25th. Crude oil prices cooled off in the month July; as of July 29th, the price of Brent fell 7.2% to $80.94 per barrel. The average price of gas inched 4 cents higher to $3.60 per gallon as of the end of July.
Fixed Income Performance: Insights into Bond ETFs & Treasury Yields
US Treasury Yield Curve

Bond Fund Performance