Market Summary: Financial Sector Leads, Inflation Data Resumes as Rate Cuts Continue in 2025
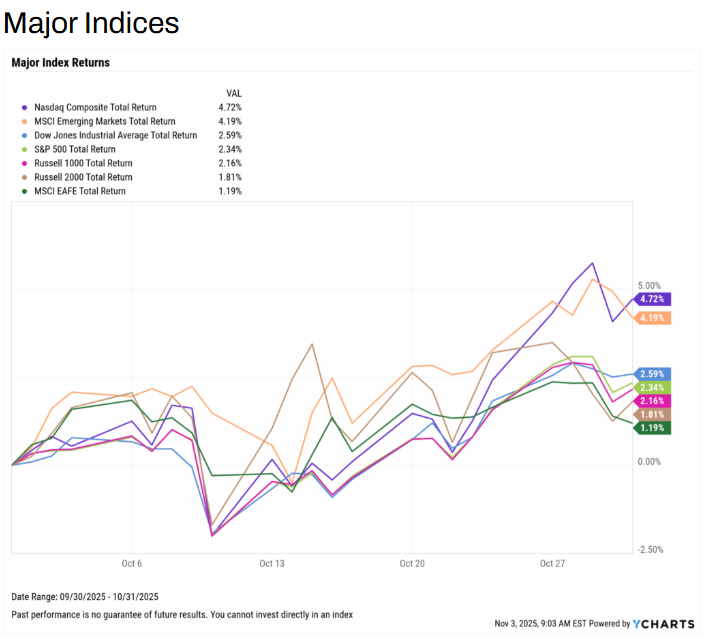
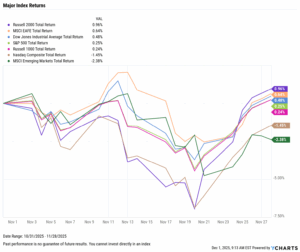
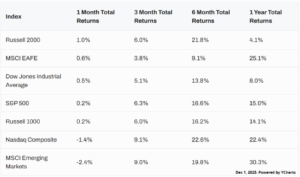
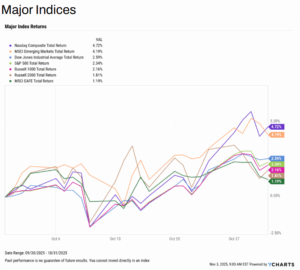
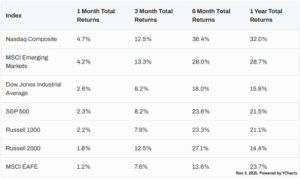
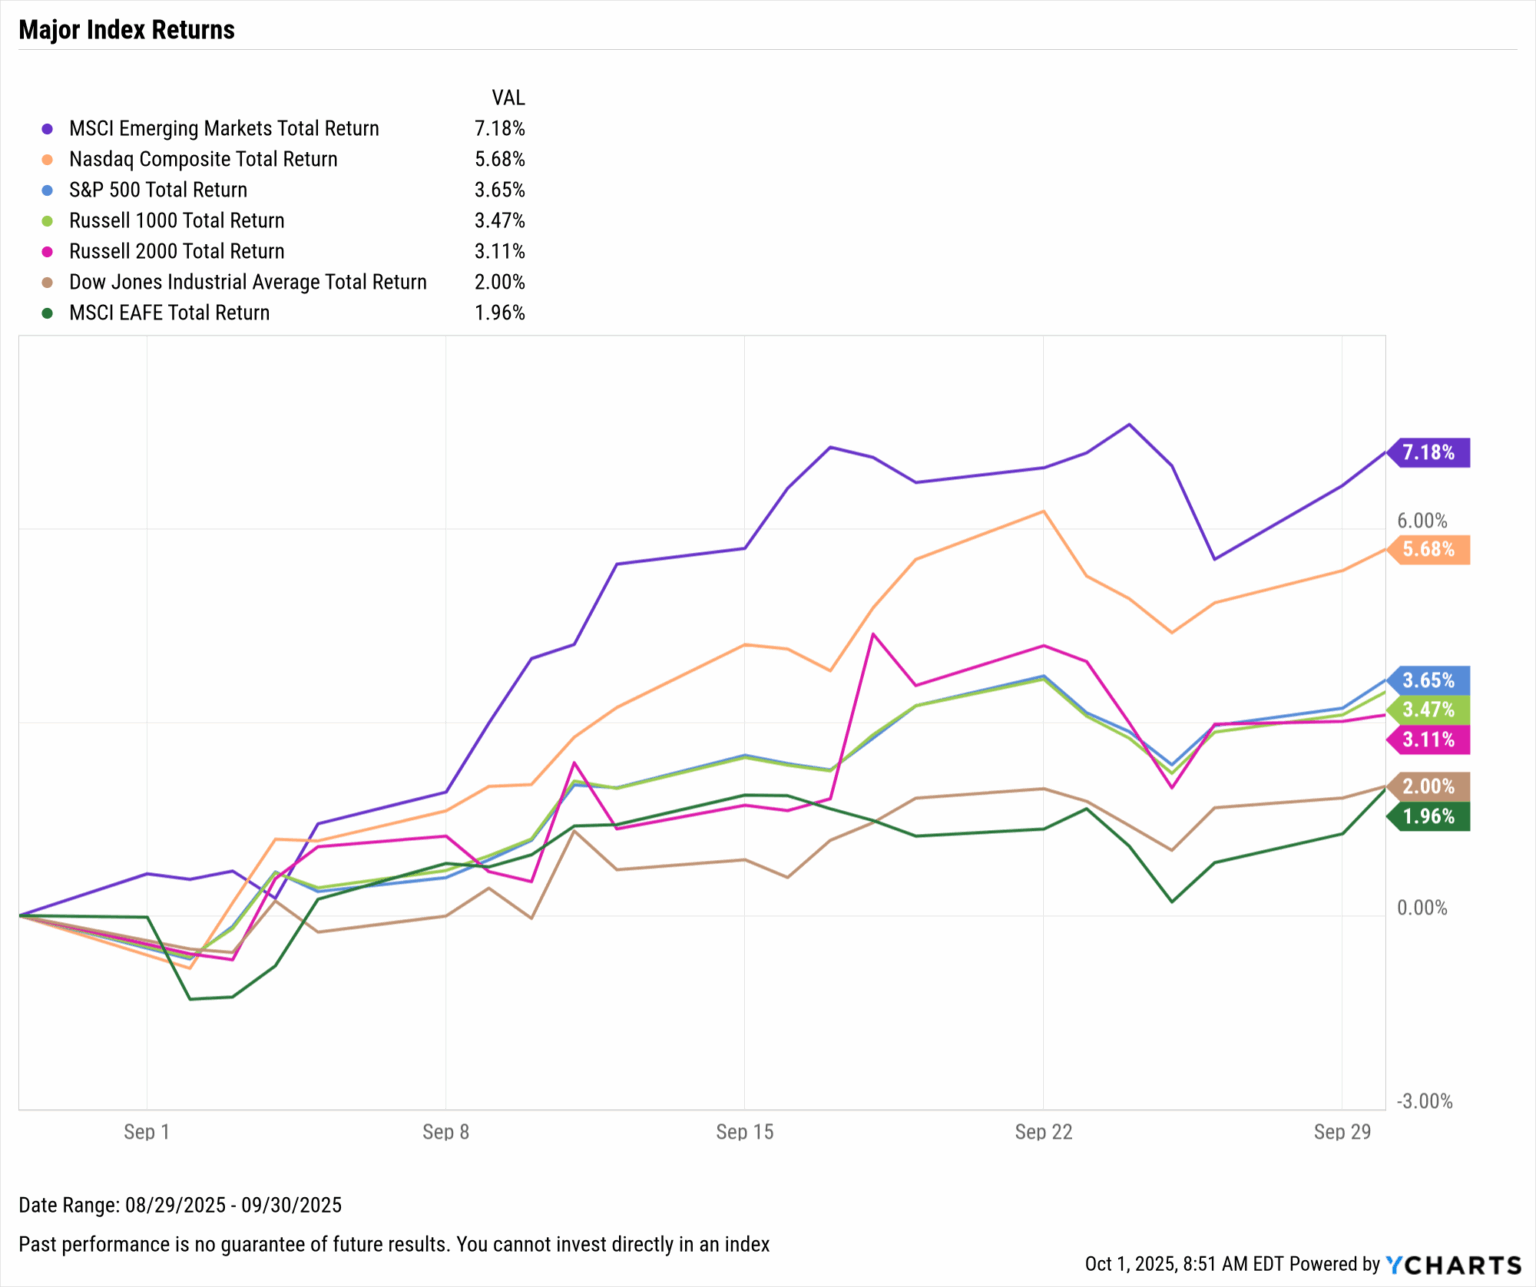
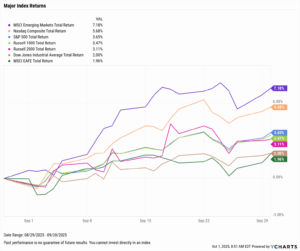
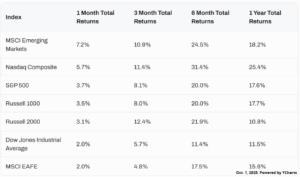
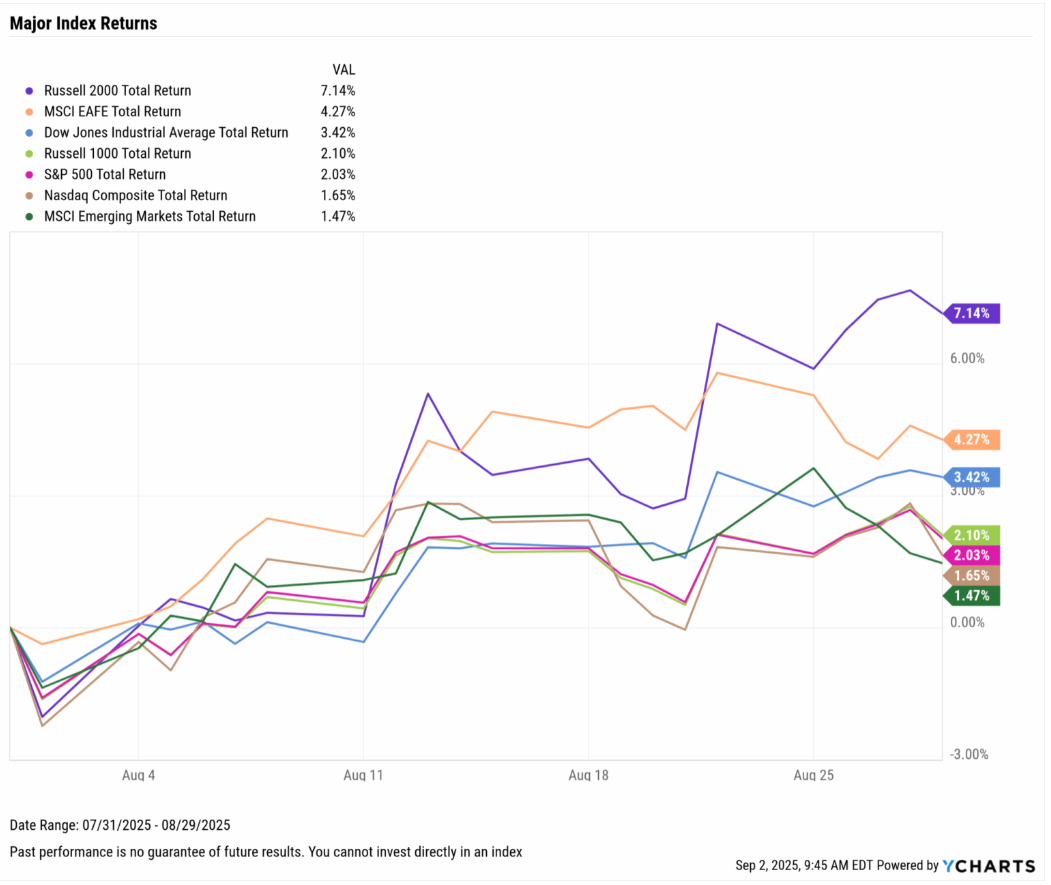
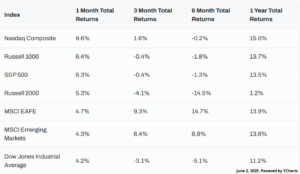
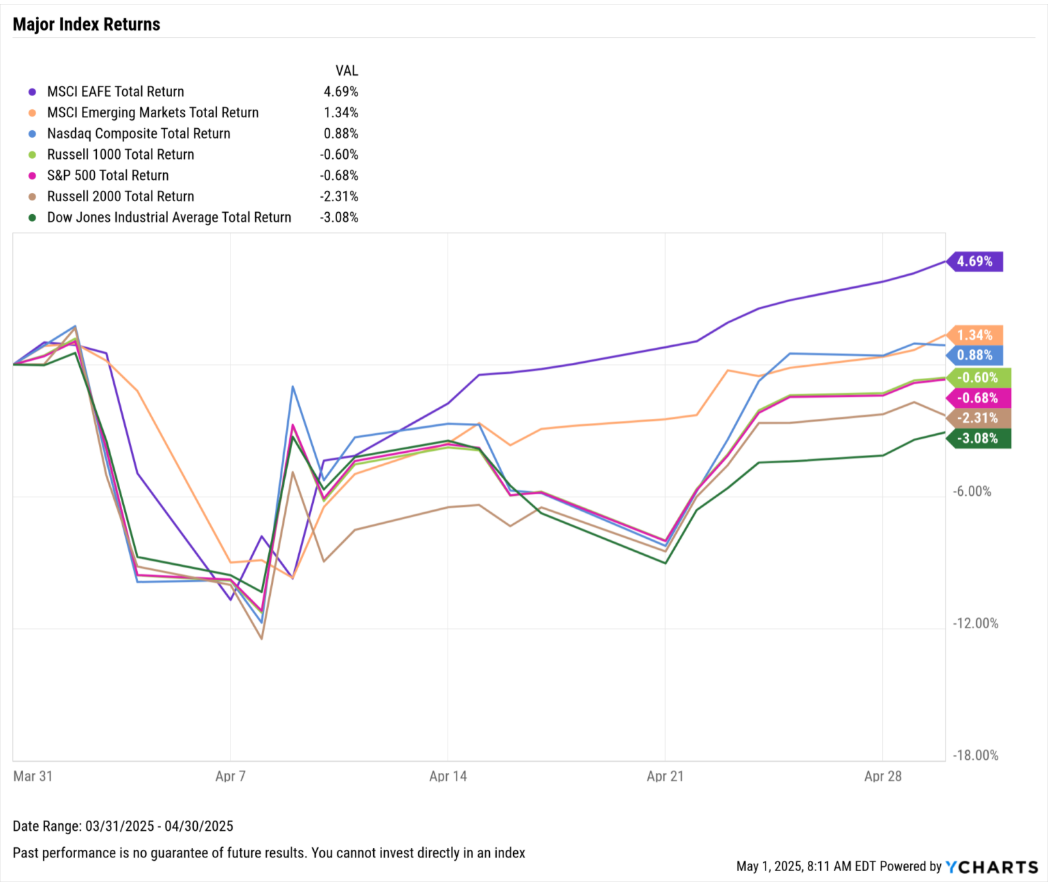
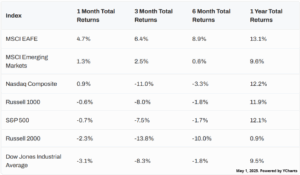
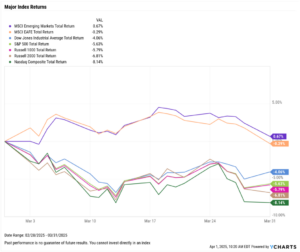
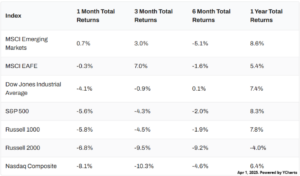
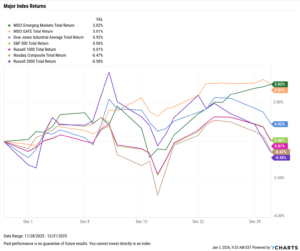
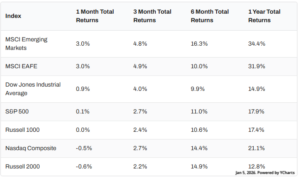
Markets were split in December as international markets finished 2025 the strongest. Emerging markets led the way, up 3% for the month, as the S&P 500 ended virtually flat. The Russell 2000 posted the worst December of all indices, down 0.6%.
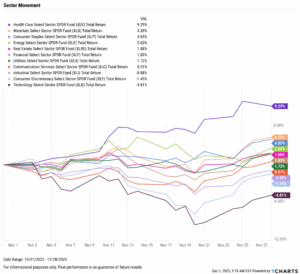
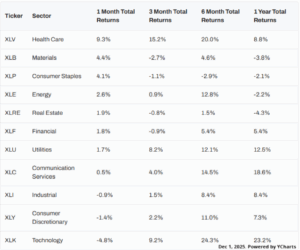
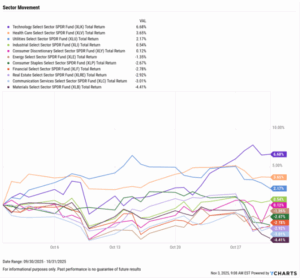
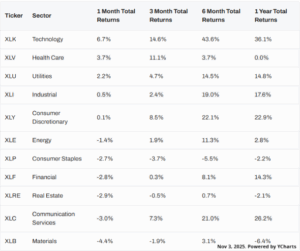
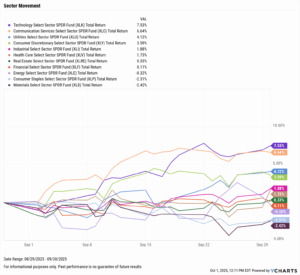
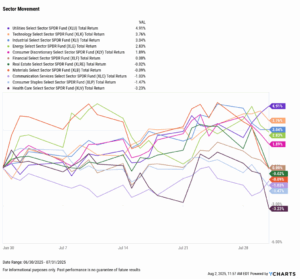
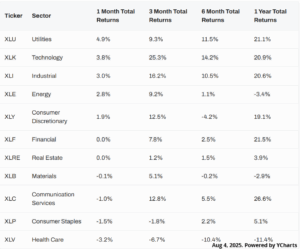
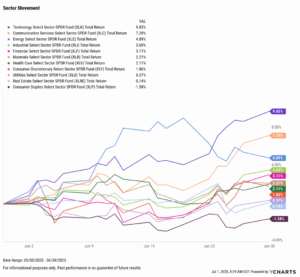
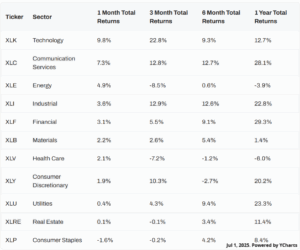
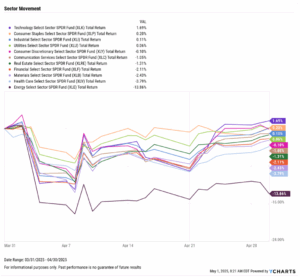
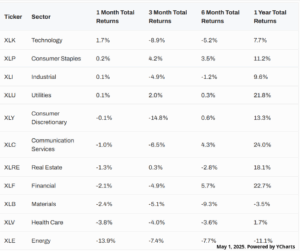
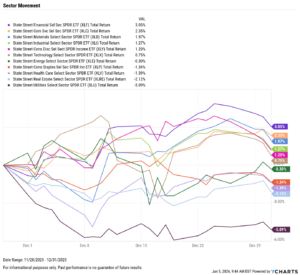
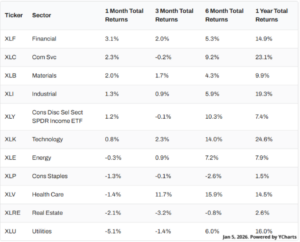
Sector performance was also split for the month, as Financials led, advancing 3.1%. Communication Services, Materials, and Technology were all positive in December. Utilities took the most significant hit, ending down 5.1%, followed by Real Estate, which was down 2.1%.
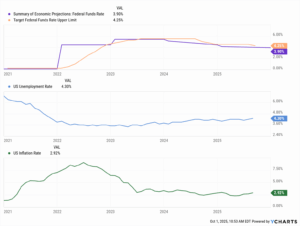
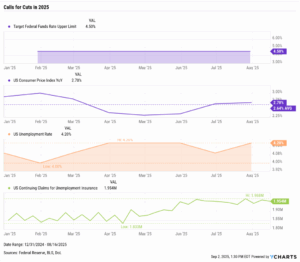
The government resumed most economic data releases, providing more visibility into the broader economy. Nonfarm payrolls for November came in positive once again, although unemployment continued to tick upwards. The Fed Funds Rate was cut an additional 25 basis points, leaving the target range at 3.50-3.75% to end 2025. Expectations are more muted for the January 28th FOMC meeting, at just a 16% chance of a fourth straight cut, according to CME FedWatch.
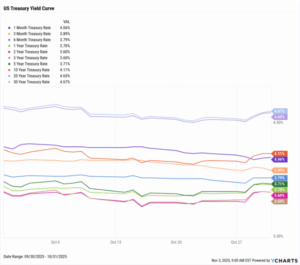
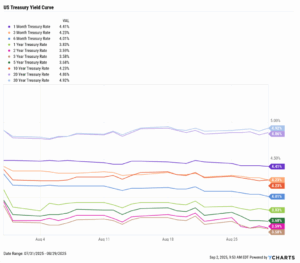
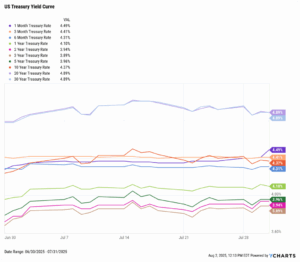
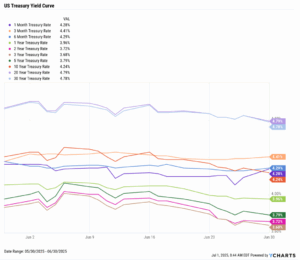
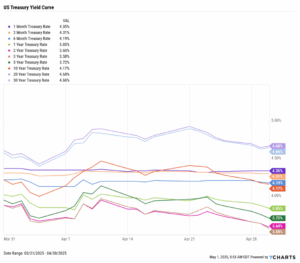
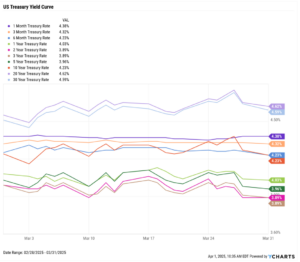
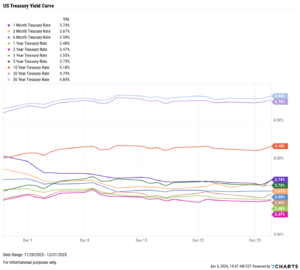
Treasury yield movement was split in December, as the short end of the curve decreased and the long end increased, with the 2-year remaining unchanged. The largest decline occurred in the 1-month, down 31 basis points to 3.74%. The 30-year had the most significant jump, up 17 basis points to 4.84%.
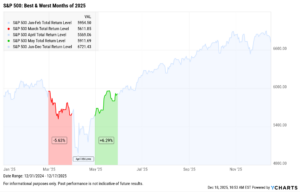
Chappell Wealth Watch! The Volatile Path to a 16.4% Growth Year
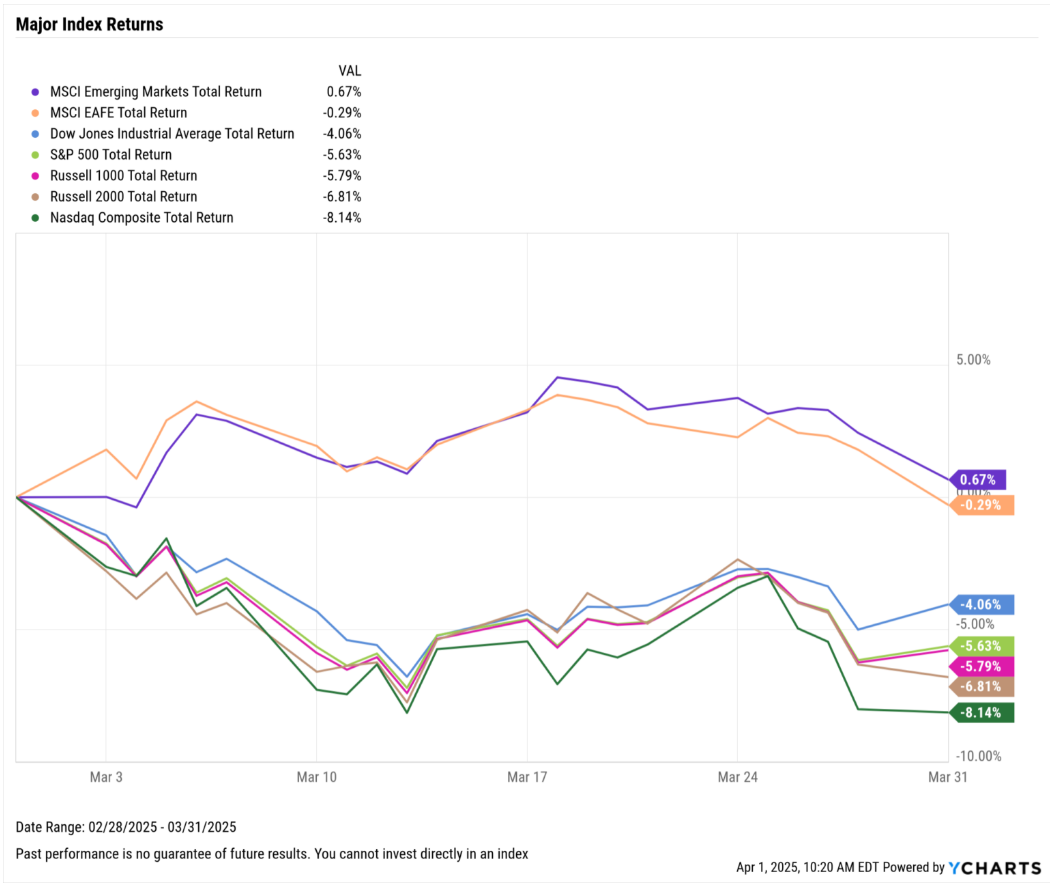
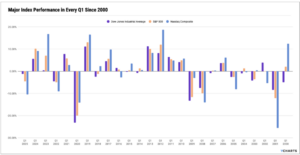
The S&P 500 finished 2025 up 16.4%, but that headline return masks one of the most volatile stretches of the year. March ultimately marked the index’s worst month of 2025, as selling pressure intensified amid rising uncertainty around tariffs and international trade policy.
Those concerns escalated into early April, when investor anxiety spiked, and the VIX surged above 52. Volatility spiked to such extremes that three of the worst trading days and the single best trading day of the year all occurred within the same week.
- April 3, 2025: down 4.84%
- April 4, 2025: down 5.97%
- April 9, 2025: up 9.52%
- April 10, 2025: down 3.46%
Markets demonstrated how quickly sentiment could reverse, leading to momentum that carried into May, making it the strongest month of the year. 2025 highlights how sharp drawdowns are a natural part of market cycles, even during prolonged periods of substantial capital appreciation.
Visualizing these swings in YCharts helps advisors contextualize volatility for clients and reinforce why staying invested through turbulent periods remains critical to long-term outcomes.
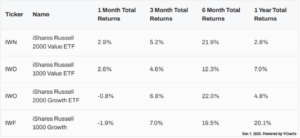
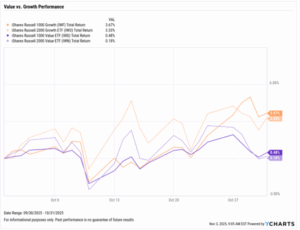
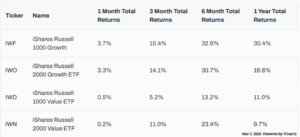
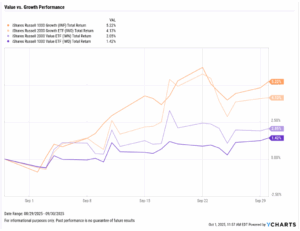
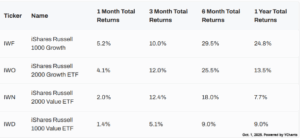
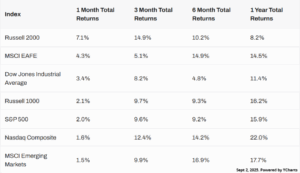
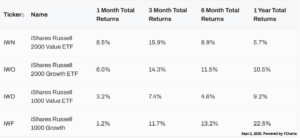
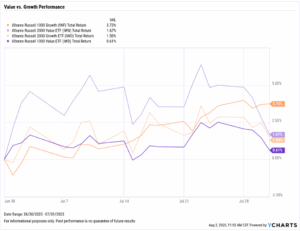
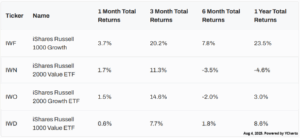
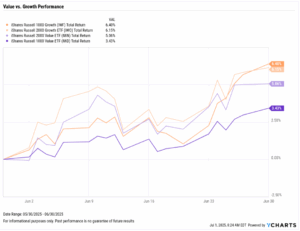
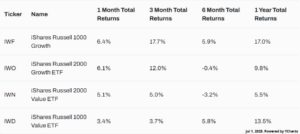
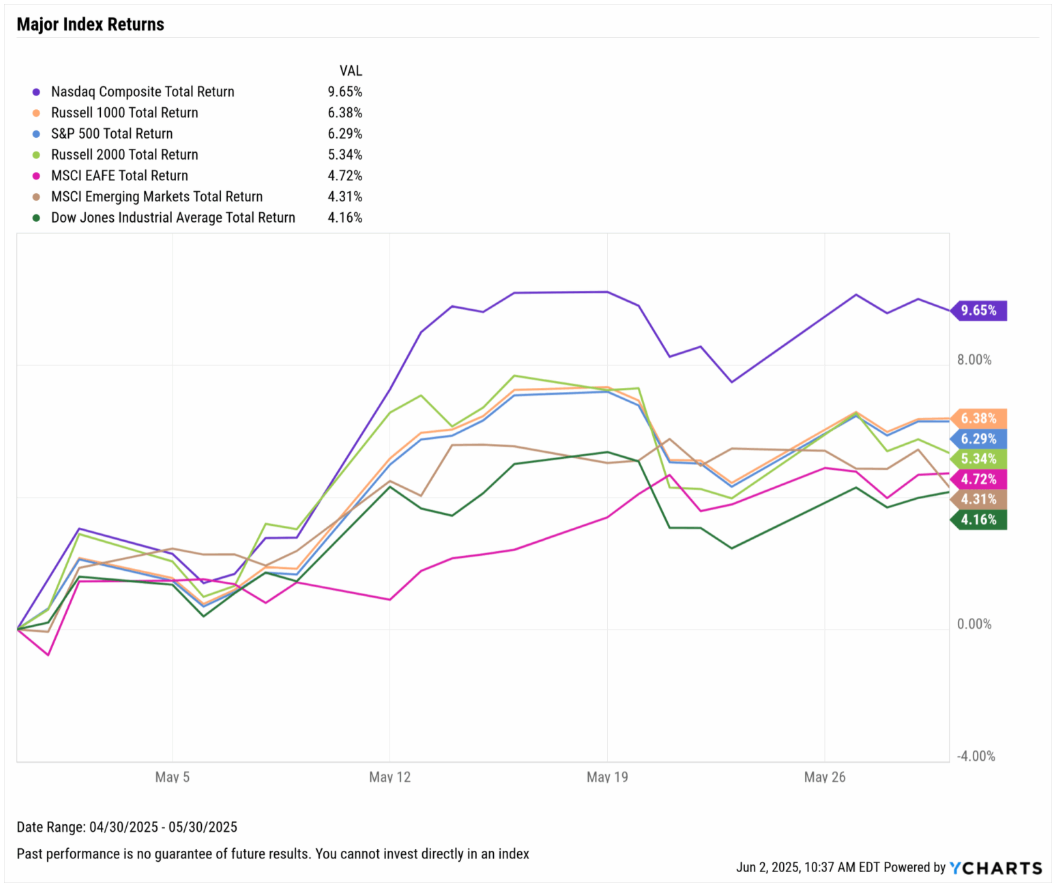
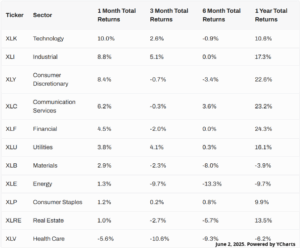
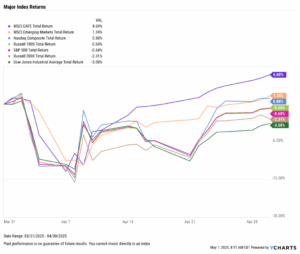
Equity Performance: International Markets Lead, Value Keeps Shining, Utilities and Real Estate Lag
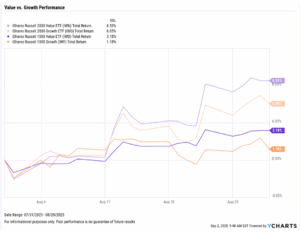
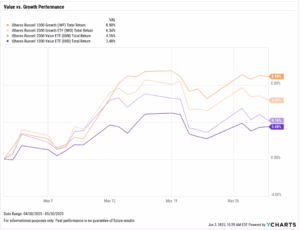
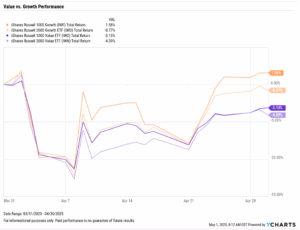
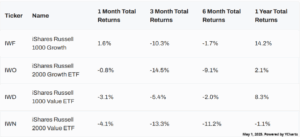
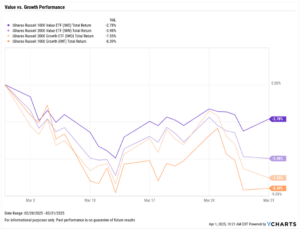
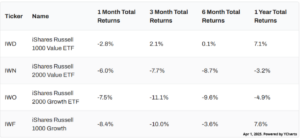
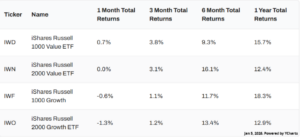
Value vs. Growth Performance
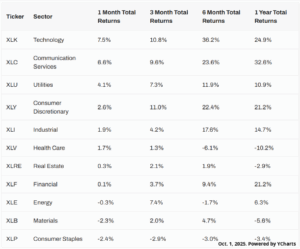
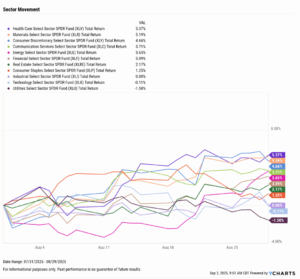
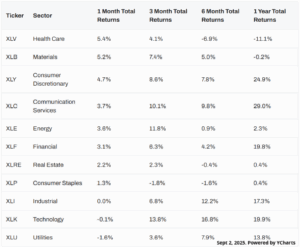
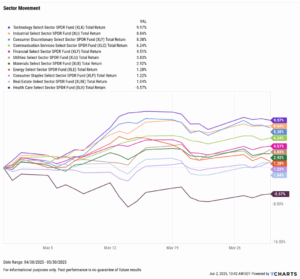
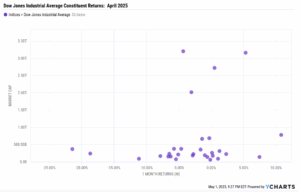
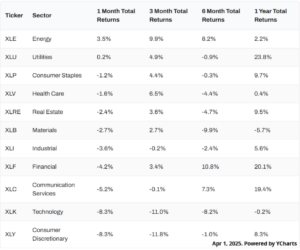
US Sector Movement
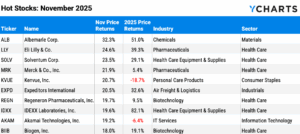
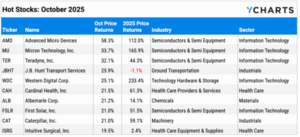
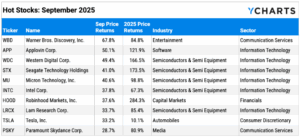
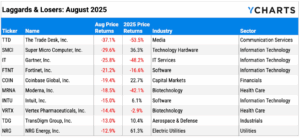
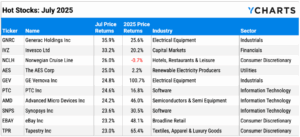
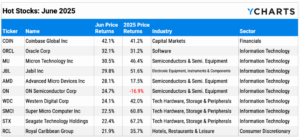
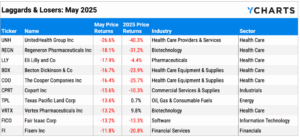
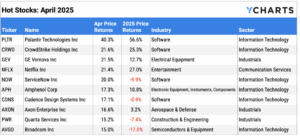
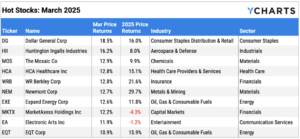
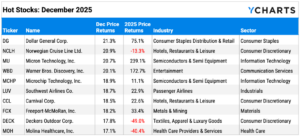
Top 10 S&P 500 Performers of December 2025
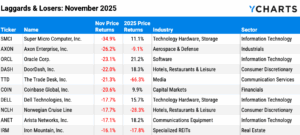
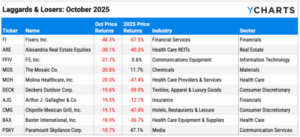
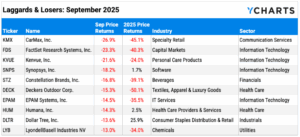
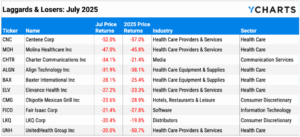
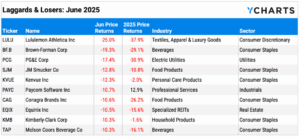
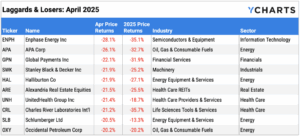
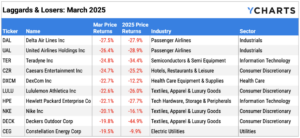
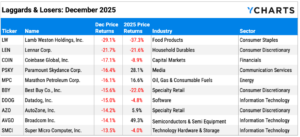
10 Worst S&P 500 Performers of December 2025
Economic Data Overview: First Inflation Read Since September, Unemployment Rises, and Gold Keeps Shining
Employment
The unemployment rate increased by 0.1 percentage points to 4.6%, and 64,000 jobs were added to the U.S. economy, according to the nonfarm payrolls report. This came in above the Dow Jones estimate of 45,000, marking a second consecutive month of exceeding expectations, following five straight months of missing the estimate.
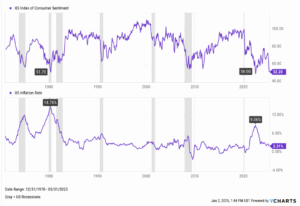
Consumers and Inflation
The US inflation rate decreased to 2.68% in November, as did core inflation to 2.69%. These are the first readings since September, as October’s data was cancelled.
The CME FedWatch tool indicates just a 16% chance for a fourth consecutive rate cut when the FOMC meets next on January 28th. Despite lacking the full scope of key economic indicators, rates were cut by an additional 25 basis points in December, totaling 75 basis points for the year.
Production and Sales
The US ISM Manufacturing PMI decreased to 48.2 in November, its second consecutive monthly decrease. The Services PMI increased 0.2 points to 52.6 in November. The YoY US Producer Price Index has remained unreleased since September due to the federal shutdown, while the US Retail and Food Services Sales increased by 0.03% in October.
Housing
Existing Home Sales increased by 0.49% MoM in November, and the Median Sales Price of Existing Homes decreased to $409,200. Mortgage rates were largely unchanged in December, ending the month at 5.44% for the 15-year and 6.15% for the 30-year.
While US New Single-Family Home Sales remain unreported, the NAHB Housing Market Index can be used to measure homebuilder confidence, providing an early indication of construction sentiment and future building activity.
Commodities
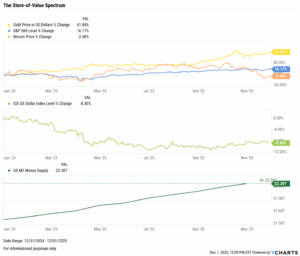
The price of gold increased by 2.1% this month, and the SPDR Gold Shares ETF (GLD) is currently trading at $396.31 per share. Silver has also posted a fantastic year, up 63.9% heading into December. Oil prices decreased, with Brent crude down 1.5% for the month to $63.10 per barrel. WTI was hit a bit less, down by 1.2% to $57.89.
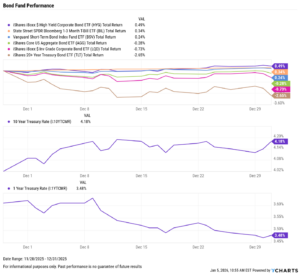
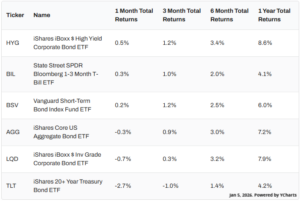
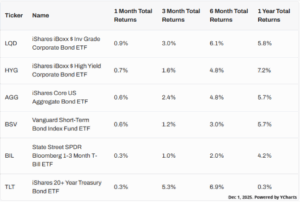
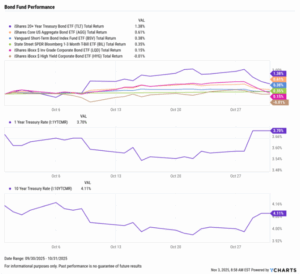
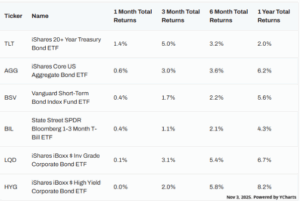
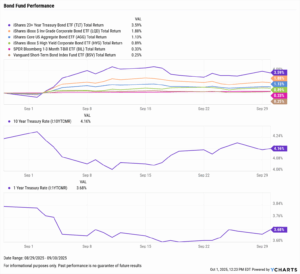
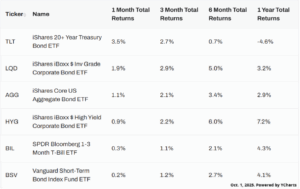
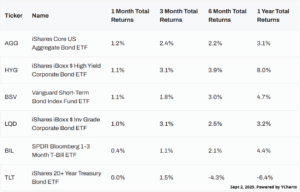
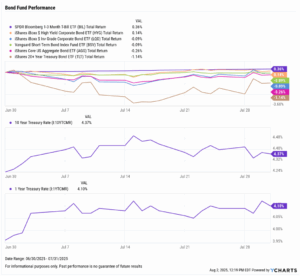
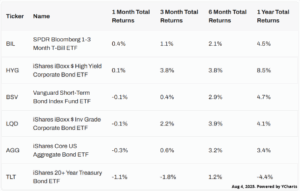
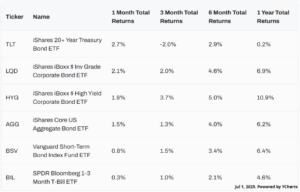
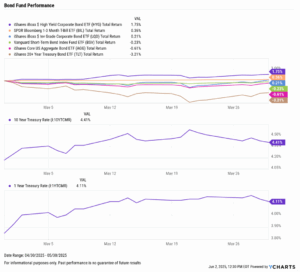
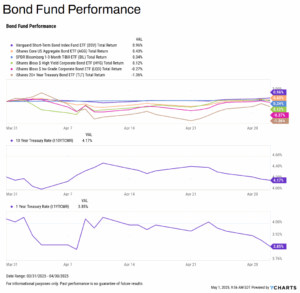
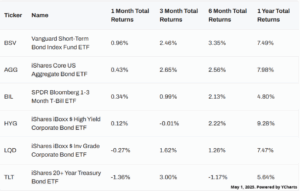
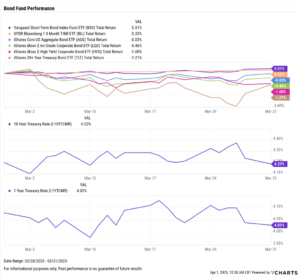
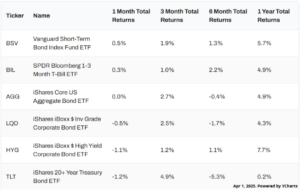
Fixed Income Performance: Insights into Bond ETFs & Treasury Yields
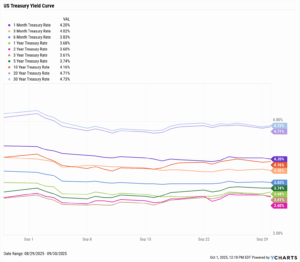
US Treasury Yield Curve
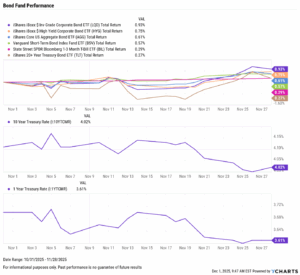
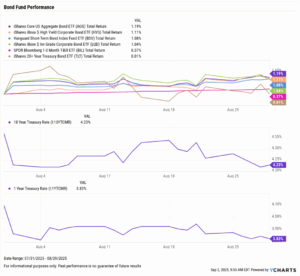
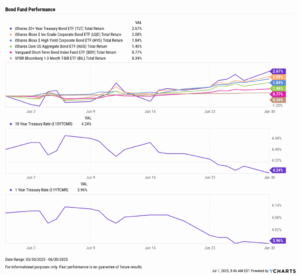
Bond Fund Performance