January 2024 Market Update
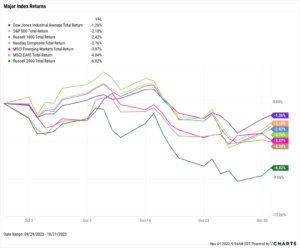
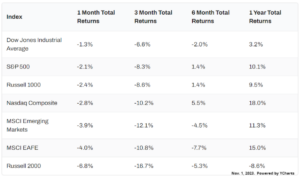
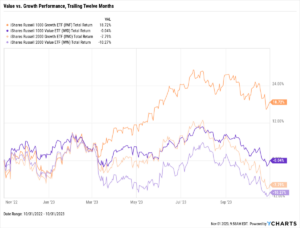
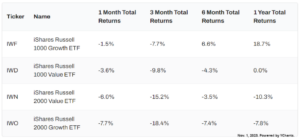
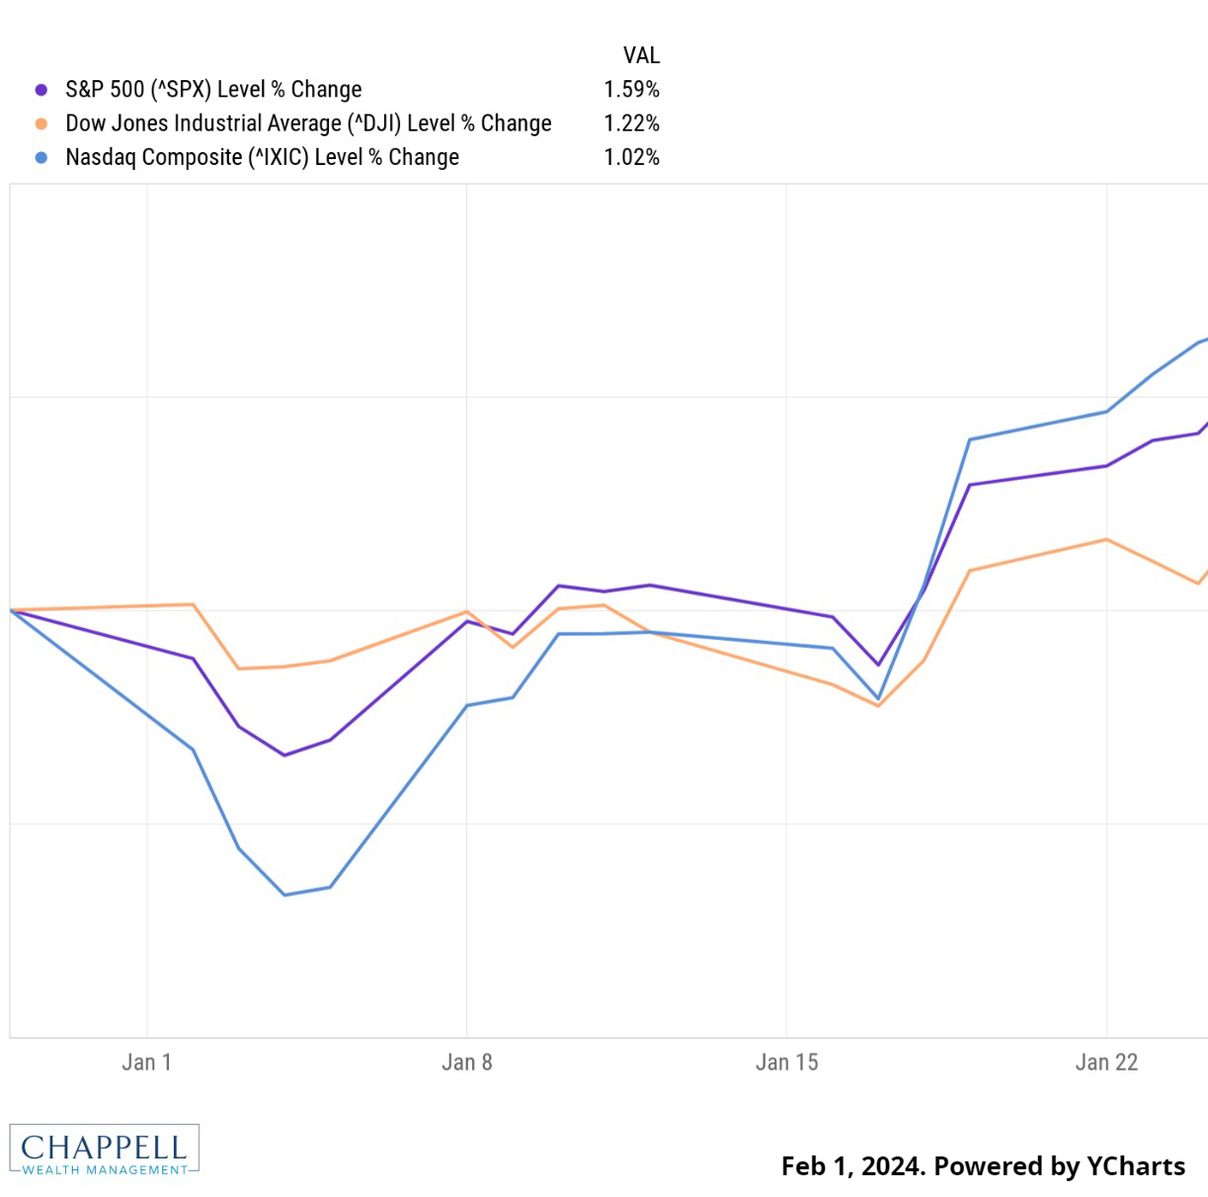
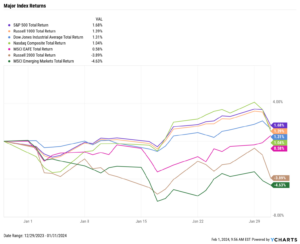
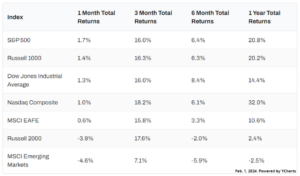
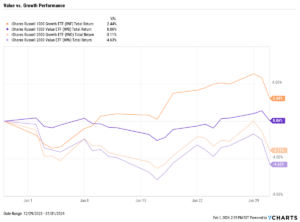
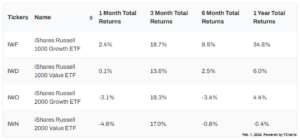
US stocks posted modest gains to start the year. The Dow Jones Industrial Average rose 1.3%, the S&P 500 advanced 1.7%, and the NASDAQ added 1.0%. Large-caps fared better than Small-caps in January–the Russell 1000 index increased 1.4%, while the Russell 2000 dropped 3.9%. Growth outperformed value within both indices.
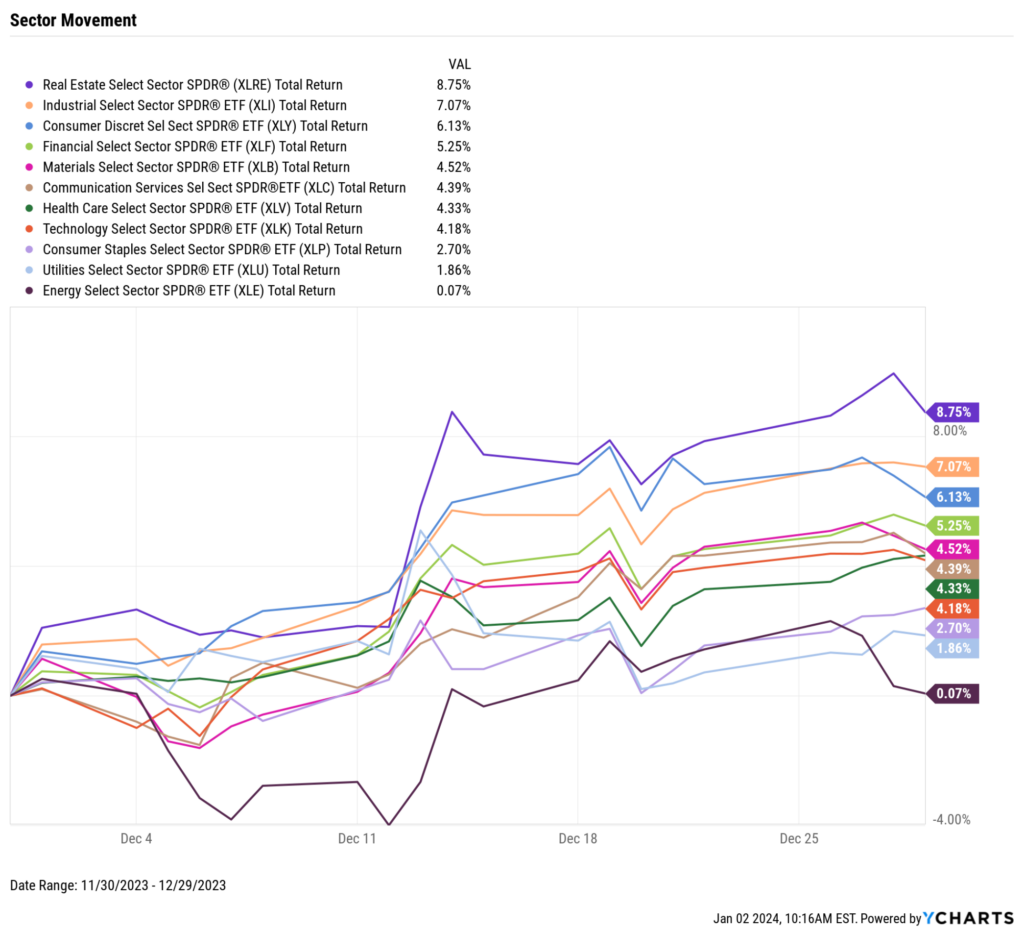
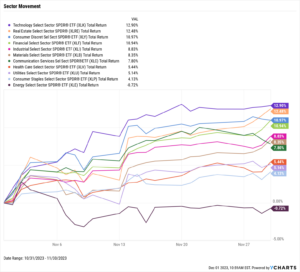
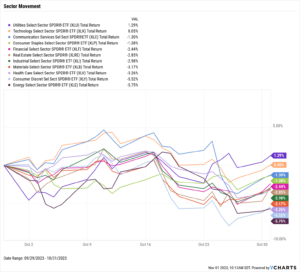
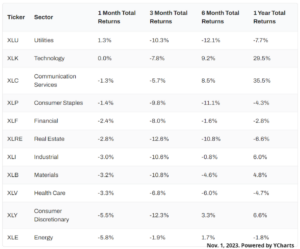
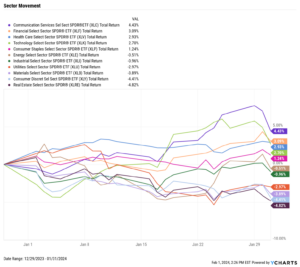
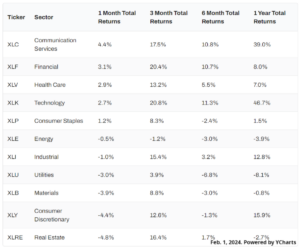
Five of eleven sectors had a positive start to 2024. Communication Services was January’s sector leader with a 4.4% gain, followed by Financials at 3.1%. The laggards this month were Materials, Consumer Discretionary, and Real Estate, the last of which posted a 4.8% decline.
The U.S. Economy added 353,000 jobs in January, nearly doubling expectations of 185,000. Unemployment and labor force participation remained unchanged at 3.7% and 62.5%, respectively. New home sales rebounded strongly in December, while mortgage rates stayed the same month-over-month. The 15-year Mortgage Rate was just below 6% as of February 1st.
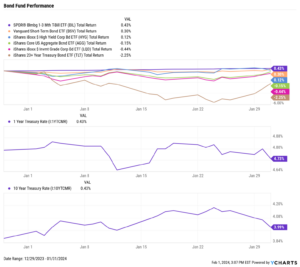
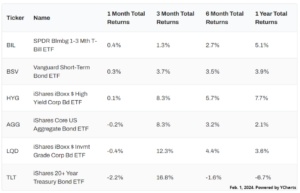
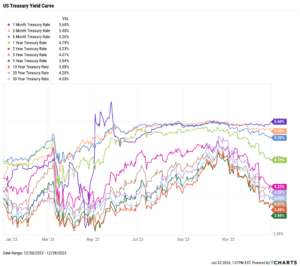
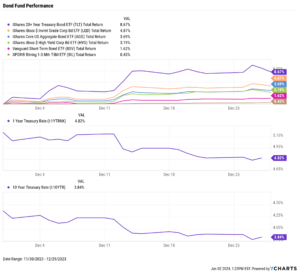
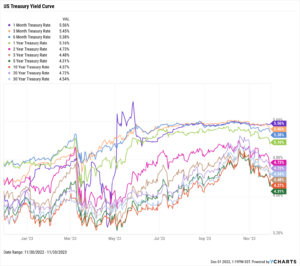
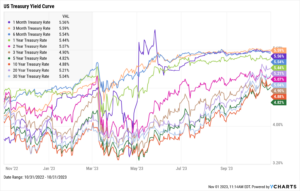
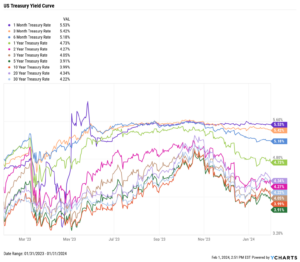
Treasury yields had an uneventful start to the year as longer-term treasuries posted slight increases. The 30-year rose 19 basis points to 4.22%, the most of any duration. The 1-month, 6-month, and 1-year T-Bills all fell by single-digit basis points. The largely muted activity in treasury yield movement translated into little movement by short-term bond ETFs, though the iShares 20+ Year Treasury Bond ETF (TLT) fell 2.3%.
Chappell Wealth Watch! Magnificent Seven vs. Magnificent Six
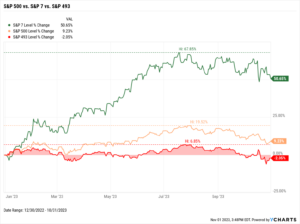
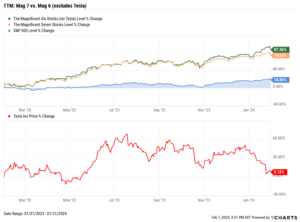
One of the top headlines from 2023 was the outperformance of the “Magnificent Seven” mega-cap stocks: Alphabet (GOOG, GOOGL), Amazon (AMZN), Apple (AAPL), Meta Platforms (META), Microsoft (MSFT), NVIDIA (NVDA), and Tesla (TSLA).
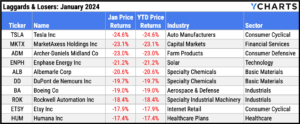
However, Tesla has been the underperformer of this group over the past twelve months. The electric vehicle manufacturer has risen 8.1% since last February, and plummeted 24.6% last month alone. This chart shows the divergence of the Magnificent Seven vs. the Magnificent Six, which excludes Tesla. The latter is 12.8 percentage points higher on a TTM basis.
Equity Performance
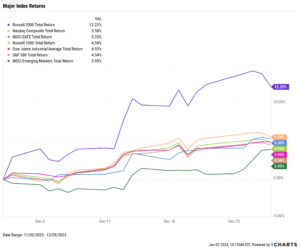
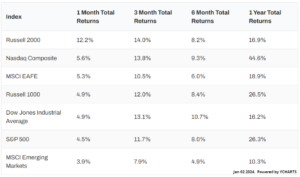
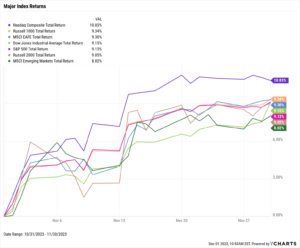
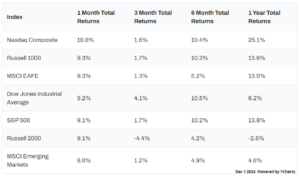
Major Indexes
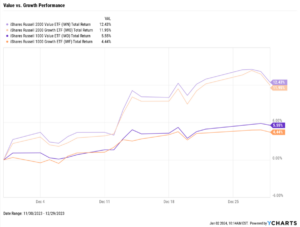
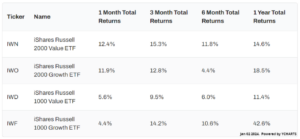
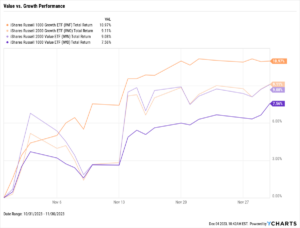
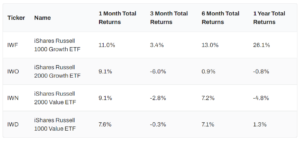
Value vs. Growth Performance
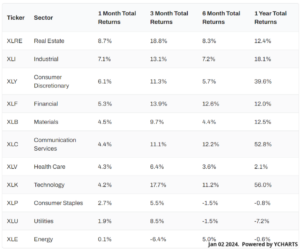
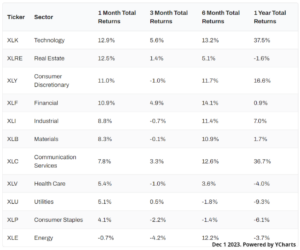
US Sector Movement
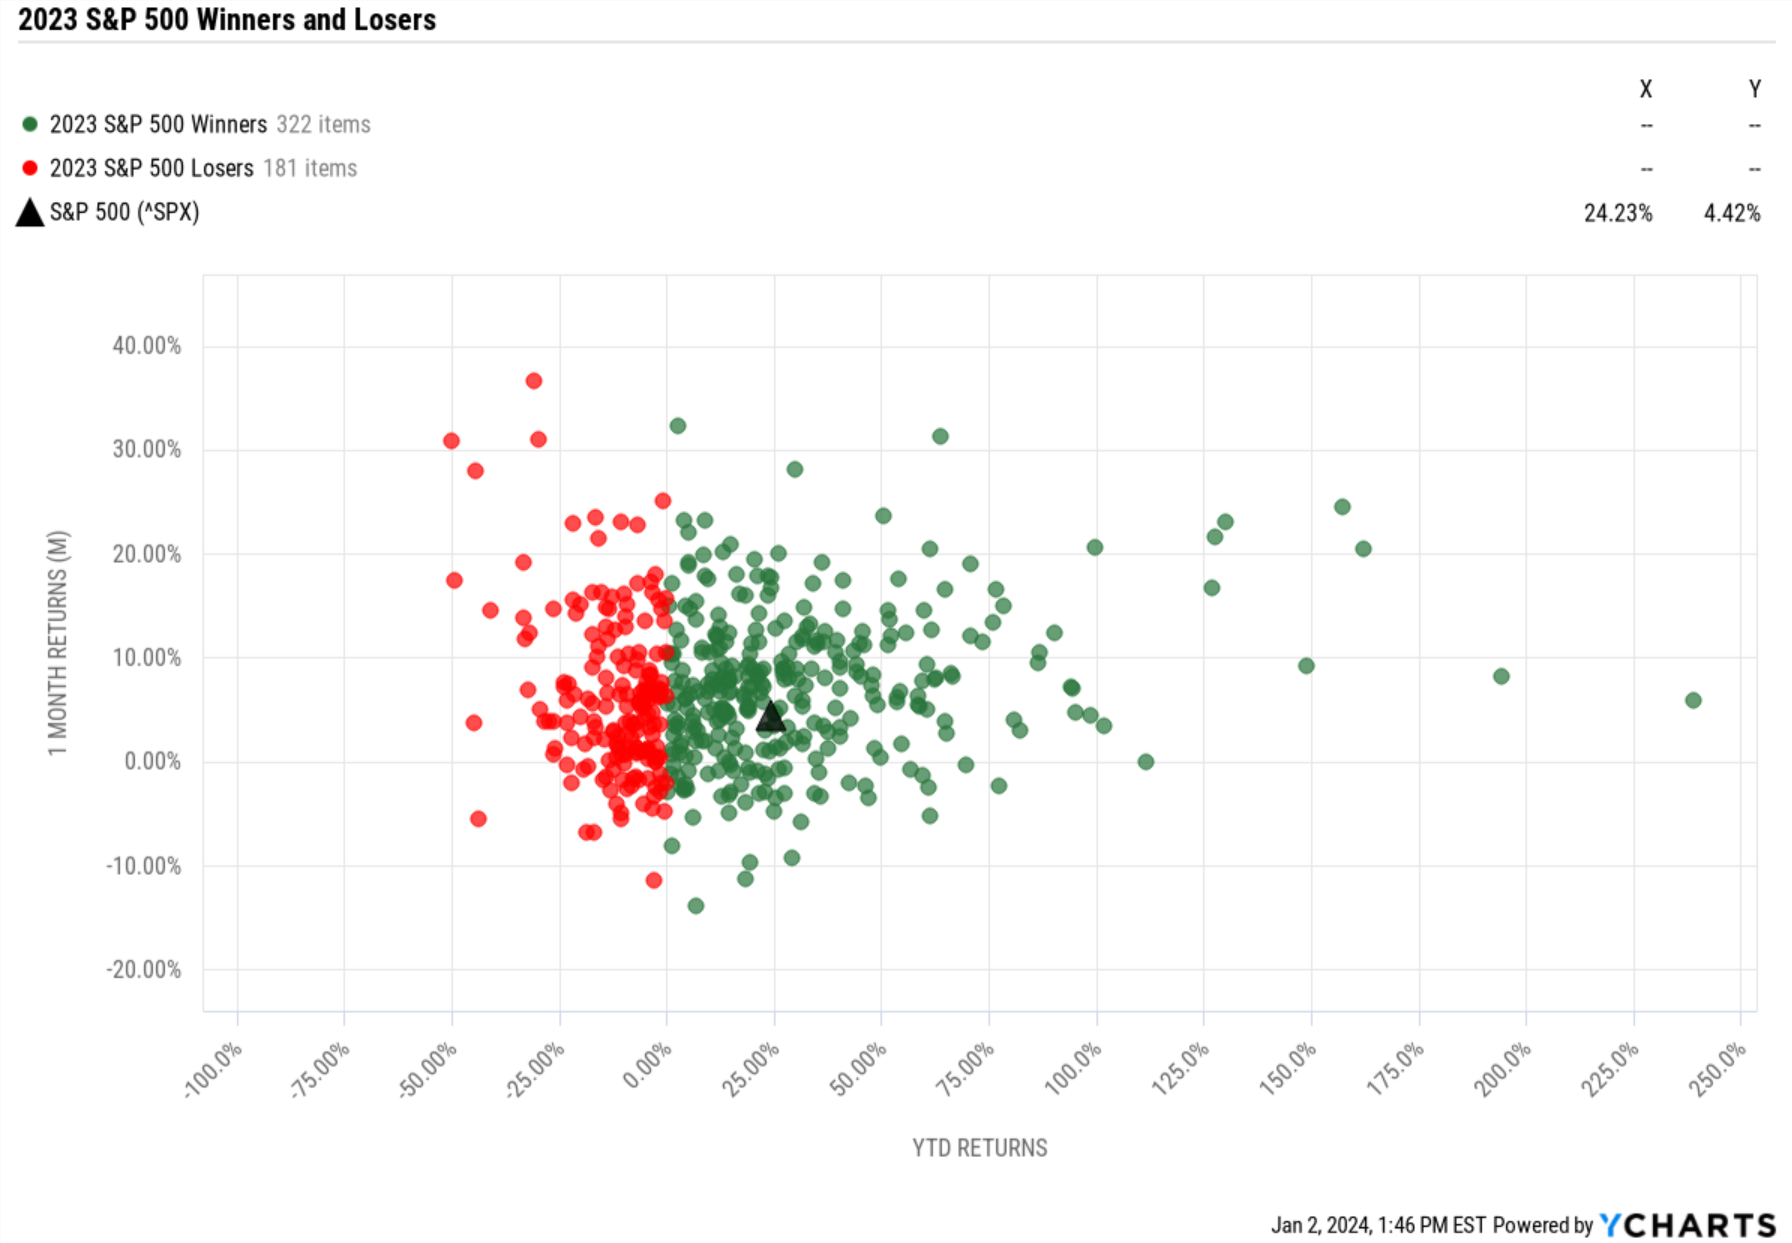
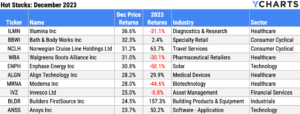
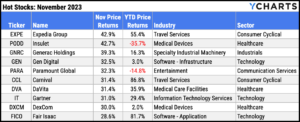
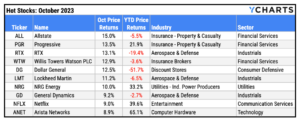
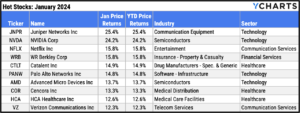
Top 10 S&P 500 Performers
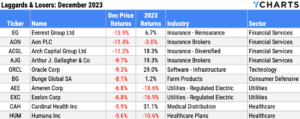
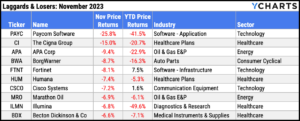
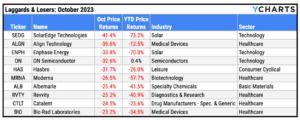
10 Worst S&P 500 Performers
Economic Data
Employment
January’s unemployment rate stayed unchanged at 3.7%, as did the labor force participation rate at 62.5%. The US unemployment rate has now come in at 3.7% for three consecutive months. 353,000 new jobs were added in January according to nonfarm payroll data, far surpassing the expected increase of 185,000.
Consumers and Inflation
The US inflation rate for December clocked in at 3.35%, marking a slight MoM increase. Inflation has hovered between 3-4% since May. Core Inflation slowed to 3.93% in December, the first time it has fallen below 4% since May 2021. The monthly US Consumer Price Index rose 0.3% in December, and monthly US Personal Spending increased 0.7%. The Federal Reserve held its key Fed Funds Rate at 5.50% at its January 31st, 2024 meeting, marking the Fed’s fourth consecutive meeting in which rates were left unchanged.
Production and Sales
The US ISM Manufacturing PMI jumped two points higher to 49.1 in January, bringing it within one point of crossing into expansion territory. December US Retail and Food Services Sales rose 0.55% MoM, while the YoY US Producer Price Index increased 0.98%.
Housing
MoM US New Single-Family Home Sales rebounded by 7.97% in December after two consecutive monthly declines. However, MoM US Existing Home Sales slipped 1.1%. The Median Sales Price of Existing Homes fell for the sixth straight month to $382,600 in December, a monthly decline of 1.3%, and is 6.7% below its all-time high set in June 2023. Mortgage rates had little movement to start the year; the 15-year Mortgage Rate was 5.94% as of February 1st, and the 30-year stood at 6.63%.
Commodities
The price of Gold declined 2.1% in January to $2,018.50 per ounce. Crude oil prices pushed higher in January; the price of WTI ended the month at $75.84 per barrel while Brent was $83.99, with respective monthly increases of 6.9% and 8.1%. The average price of gas fell 2 cents per gallon in January despite the higher oil prices, closing the month at $3.21/g.
Fixed Income
US Treasury Yield Curve
Bond Fund Performance