October 2024 Market Summary: Equities Stall, Job Numbers Disappoint, and Treasury Yields Rise
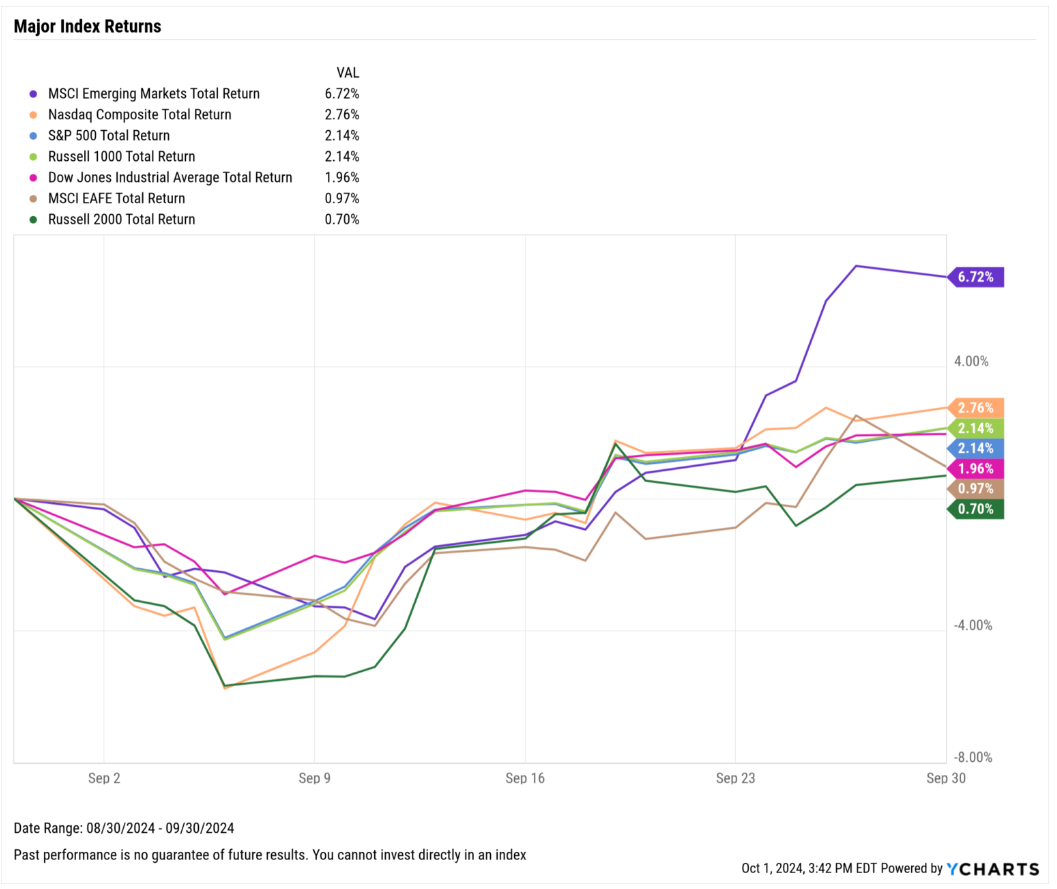
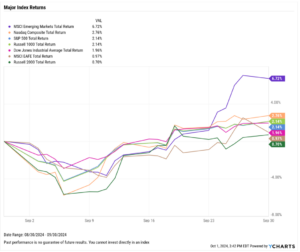
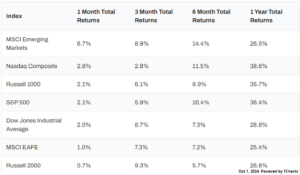
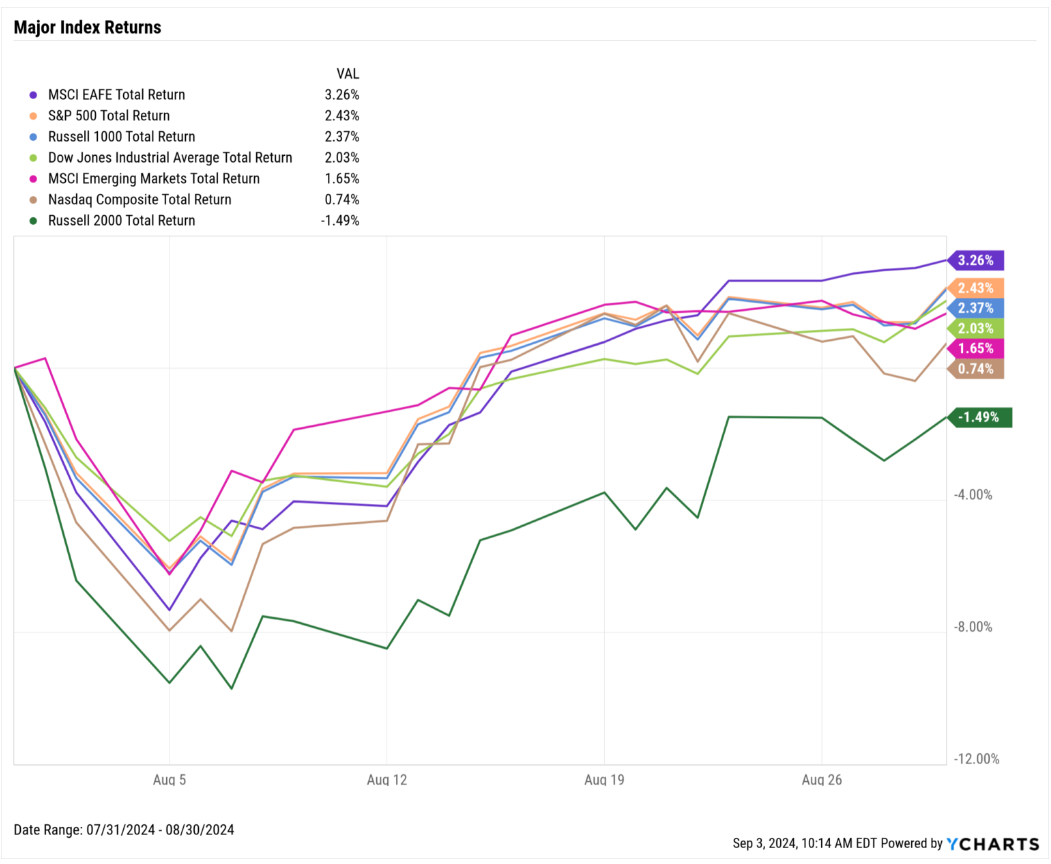
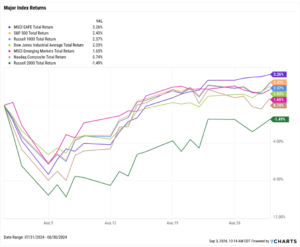
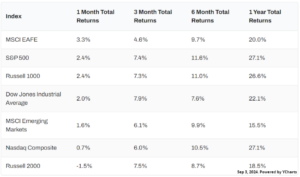
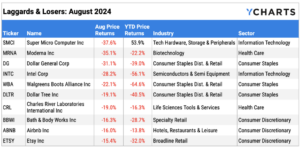
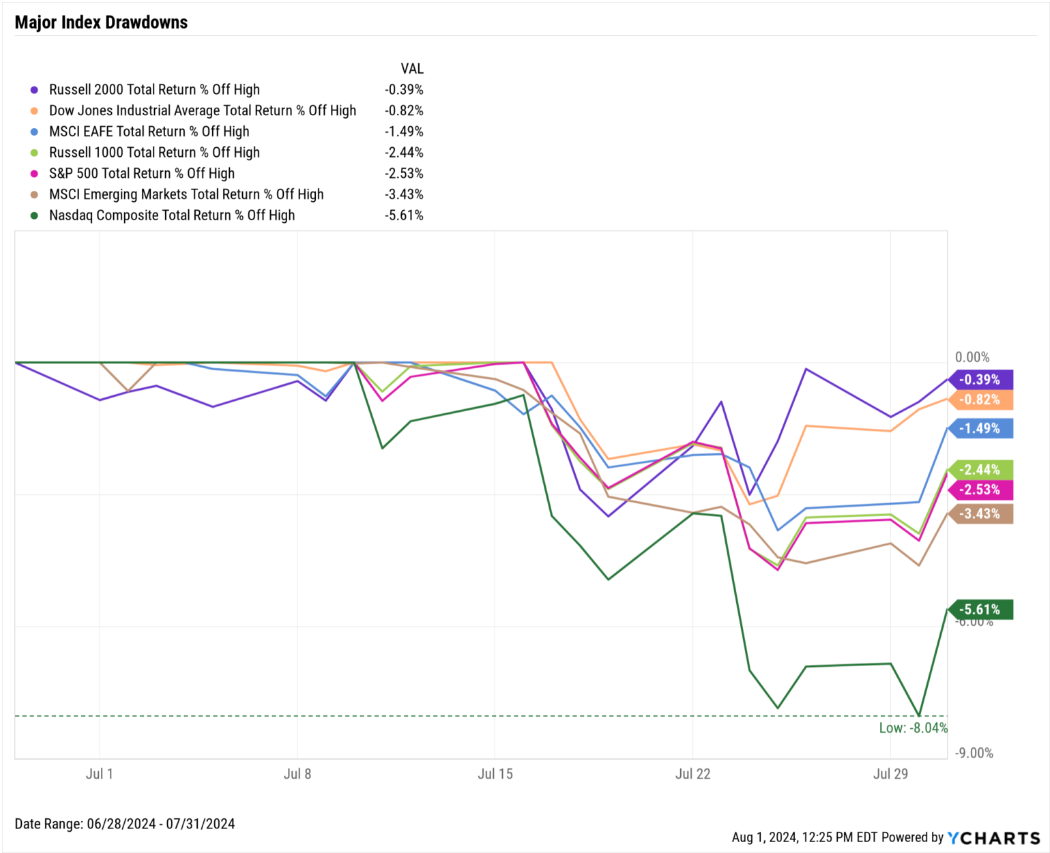
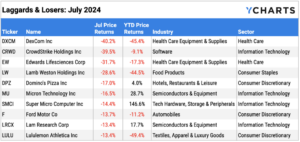
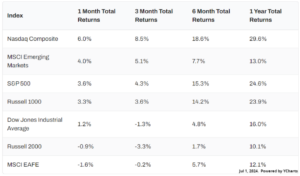
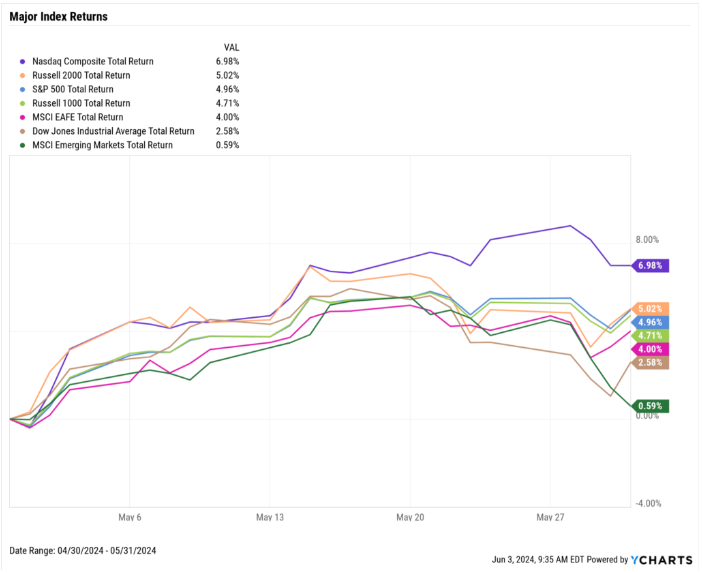
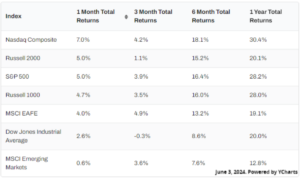
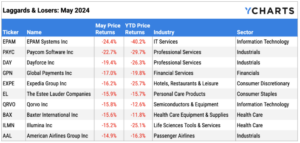
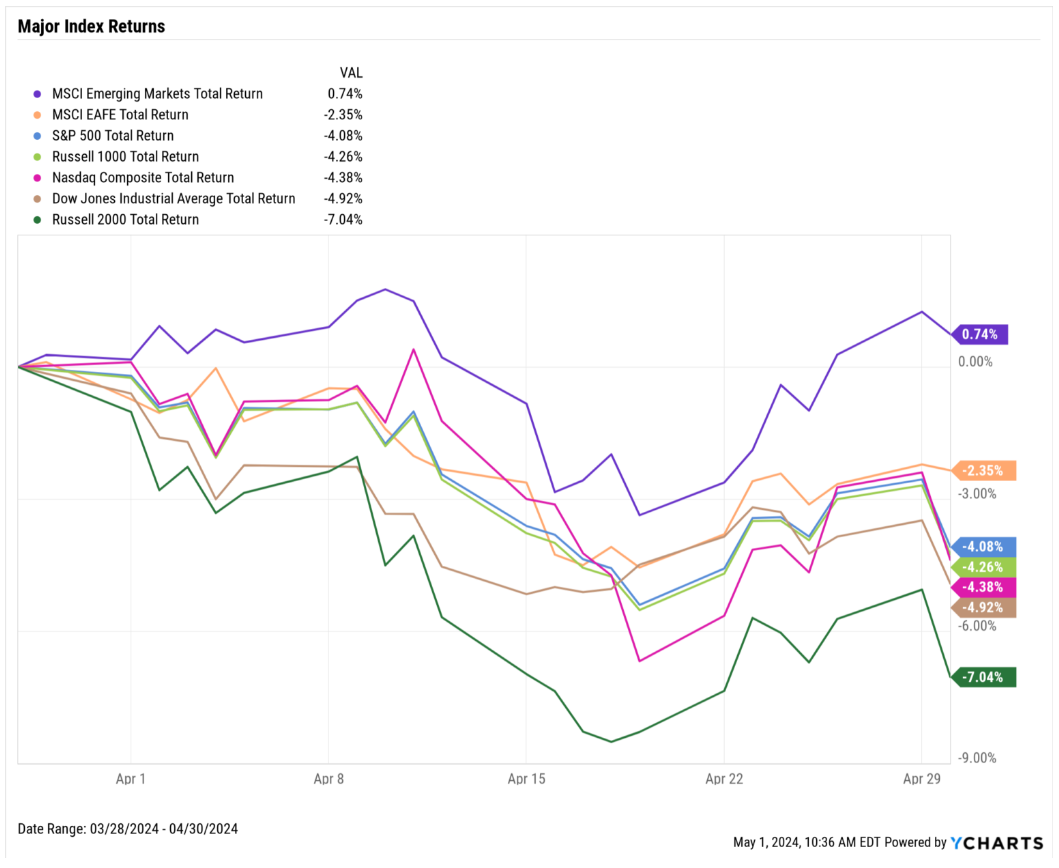
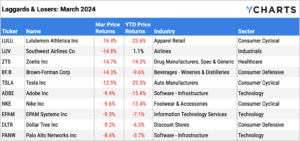
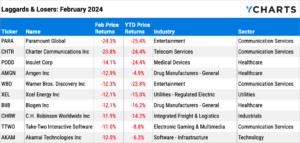
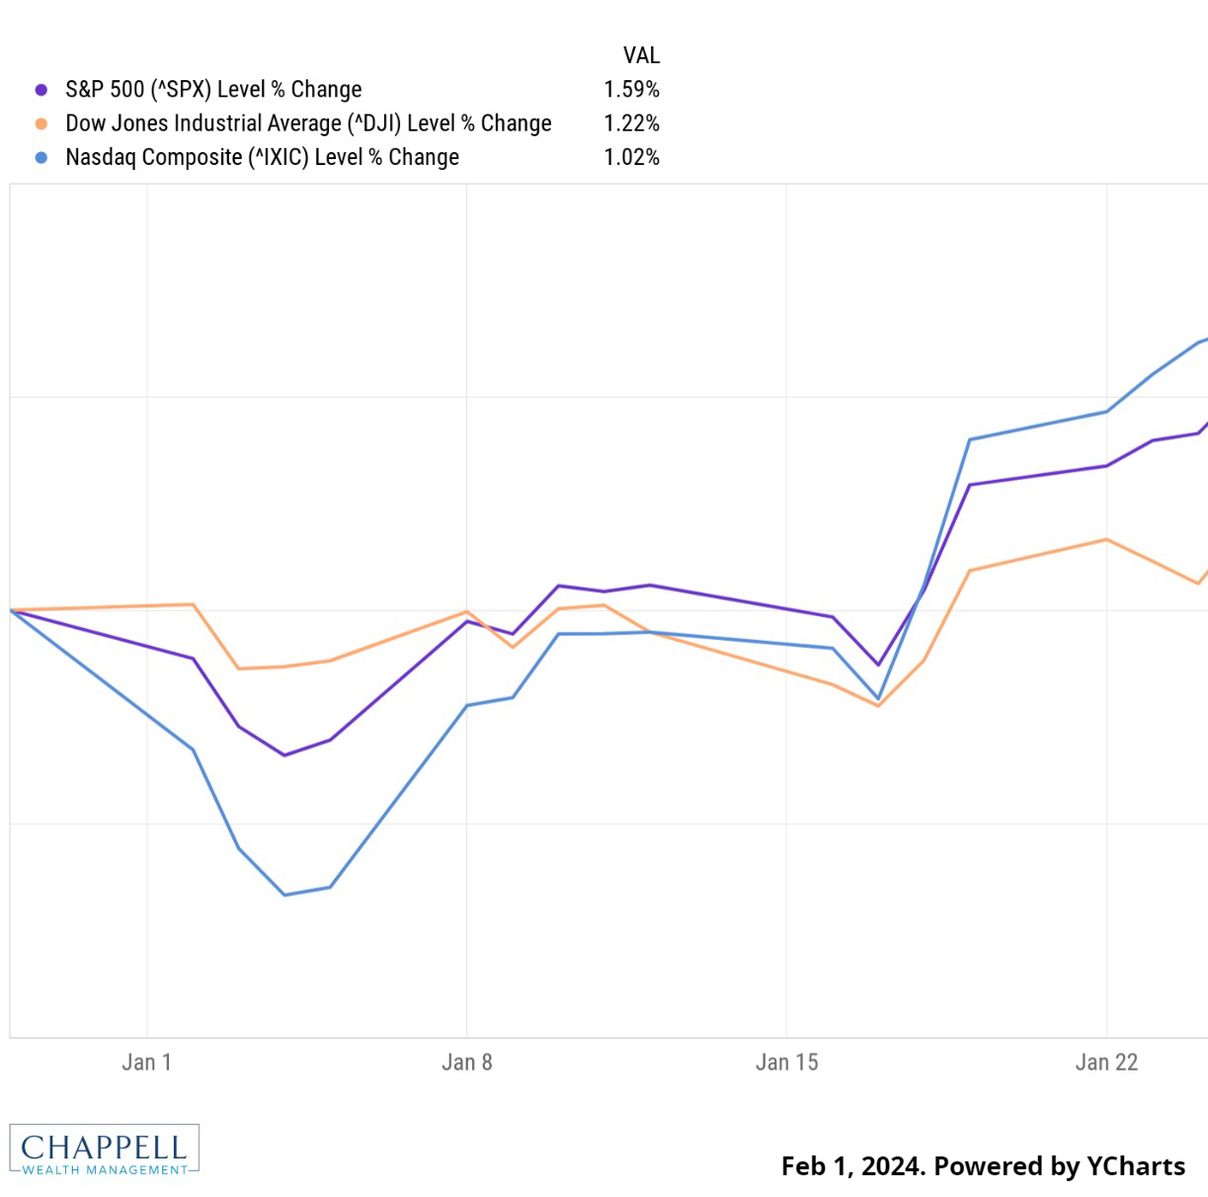
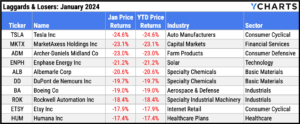
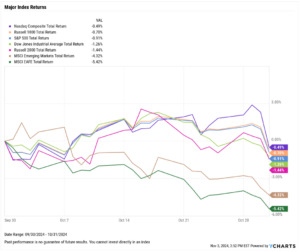
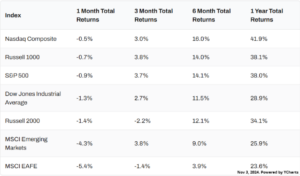
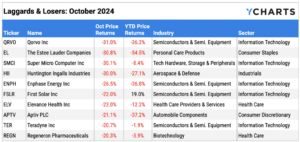
Equities slid in October as the 2024 presidential election drew near. The S&P 500 fell 0.9%, the Nasdaq Composite slipped 0.5%, and the Dow Jones Industrial Average lost 1.3% in October. Semiconductor stock underperformance particularly weighed on markets; four of the ten worst performing S&P 500 stocks were companies in the semiconductors & semiconductor equipment industry, along with Super Micro Computer (SMCI). Ex-US indices logged worse performances this month; Emerging Markets sank 4.3% and Developed Markets tumbled 5.4%.
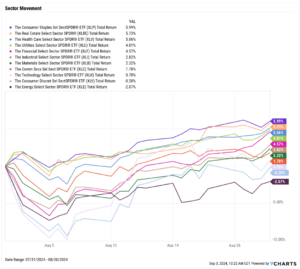
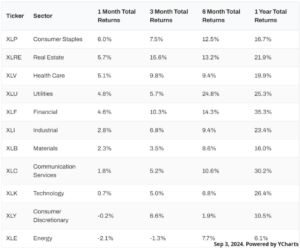
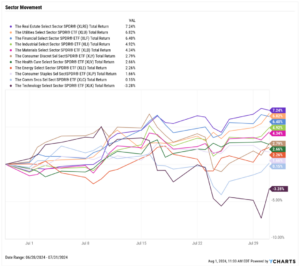
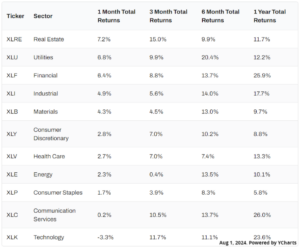
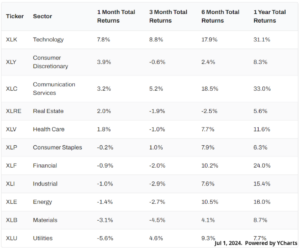
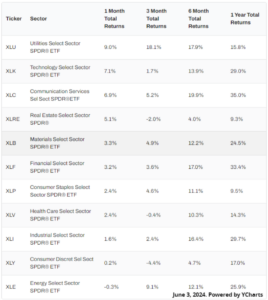
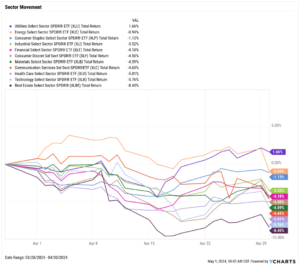
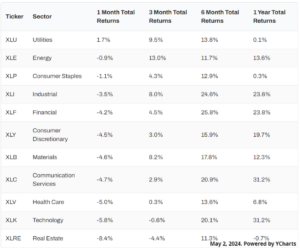
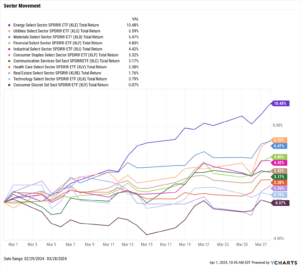
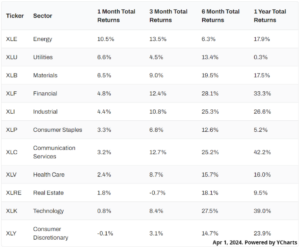
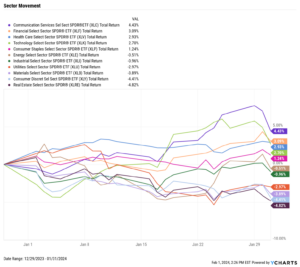
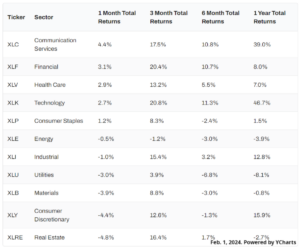
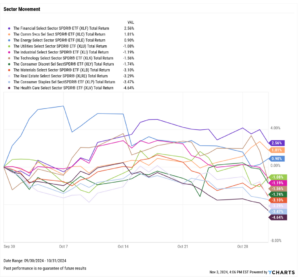
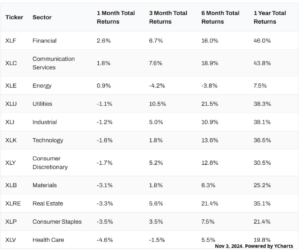
Eight of eleven sectors finished last month in the black; this month, it was the opposite. Only three sectors–Financials, Communication Services, and Energy–had a positive October. The worst-performing sector was Health Care, which lost 4.6% in October. Close behind was Consumer Staples (-3.5%) and Real Estate (-3.3%), the latter of which was affected by slowing home sales and prices along with spiking mortgage rates.
The Economy added just 12,000 jobs in October, the lowest monthly figure since December 2020. October saw several divergences among economic indicators: inflation fell while core inflation rose, the US ISM Manufacturing PMI declined as the Services PMI jumped higher, and mortgage rates spiked significantly even as Fed watchers expect the Fed Funds Rate to be cut by 25 basis points at the next FOMC meeting on November 7th, according to CME FedWatch.
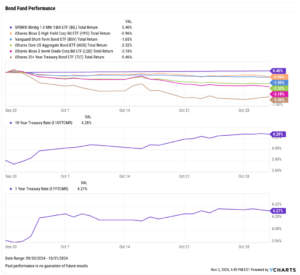
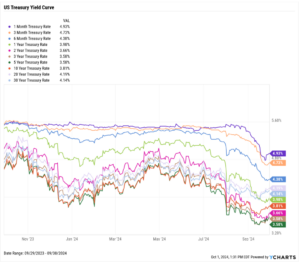
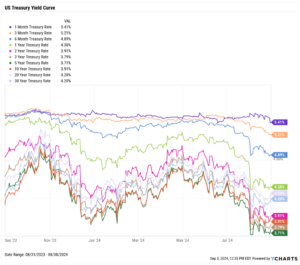
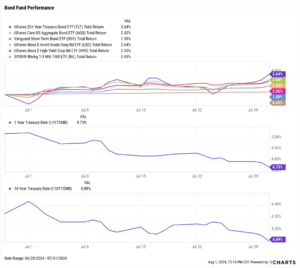
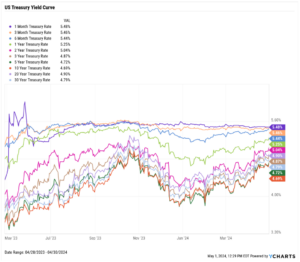
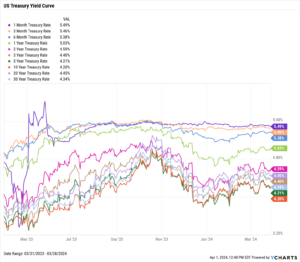
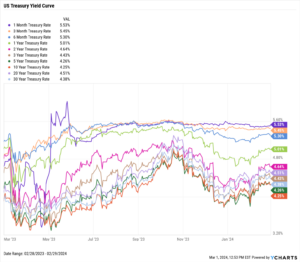
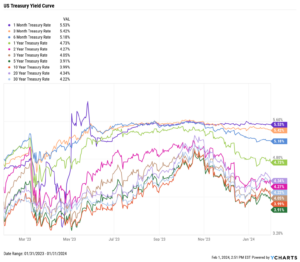
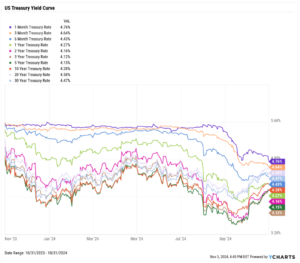
Treasury yields shot higher in the middle and longer portion of the curve even as future Fed rate cuts are expected as early as the November 7th FOMC meeting. The 3-year and 5-year Treasury Note yields rose the most of any durations on the curve, gaining 54 and 57 basis points, respectively. Yields on the 1-month and 3-month Treasury Bills declined in October.
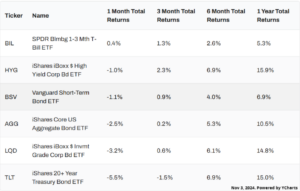
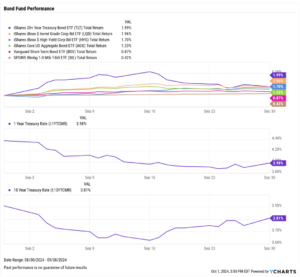
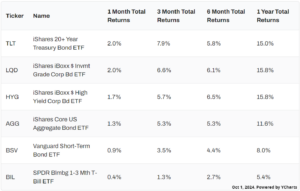
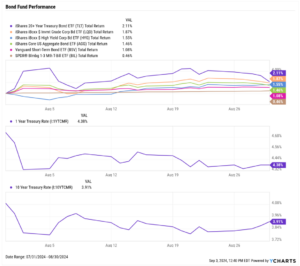
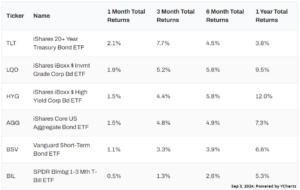
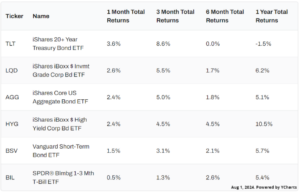
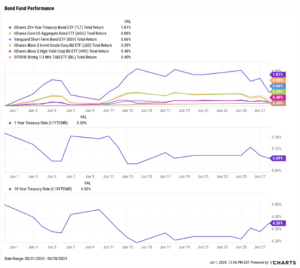
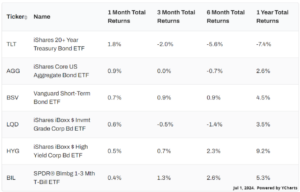
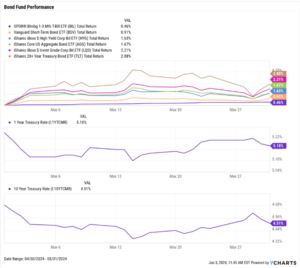
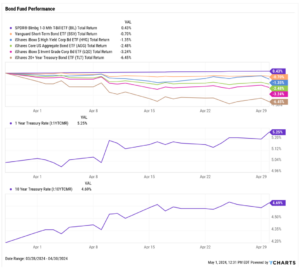
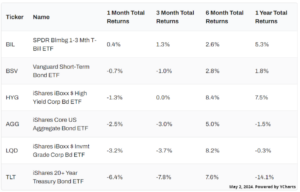
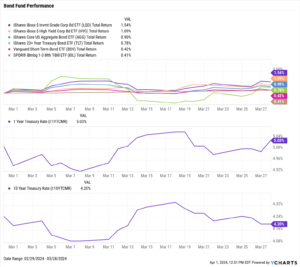
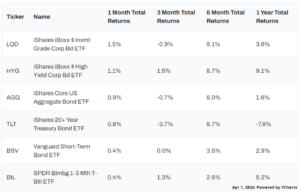
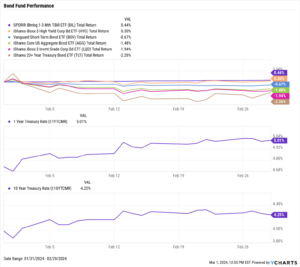
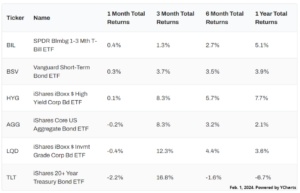
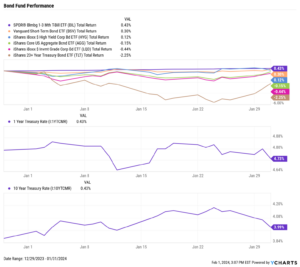
Several bond funds took a hit as a result of the increasing yields. The iShares 20+ Year Treasury Bond ETF (TLT) fell 5.5% in October, and the iShares iBoxx Investment Grade Corporate Bond ETF (LQD) lost 3.2%. Declines in the 1-month and 3-month T-Bill yields helped move the short-duration SPDR® Bloomberg 1-3 Month T-Bill ETF (BIL) higher by 0.4%.
Chappell Wealth Watch! Should the Election Cause You to Change Investing Strategies?
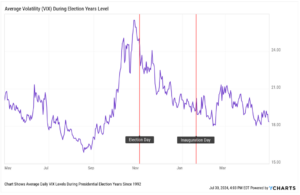
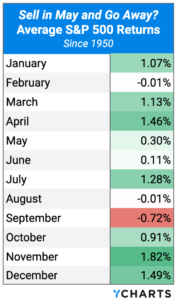
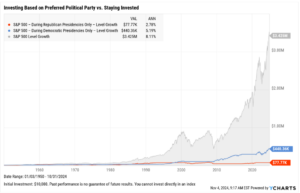
The 2024 presidential election has arrived. Though elections often bring added volatility to markets, our 2024 Election Guide for Advisors found that making investing decisions based on election outcomes is not as beneficial in the long-run versus staying the course.
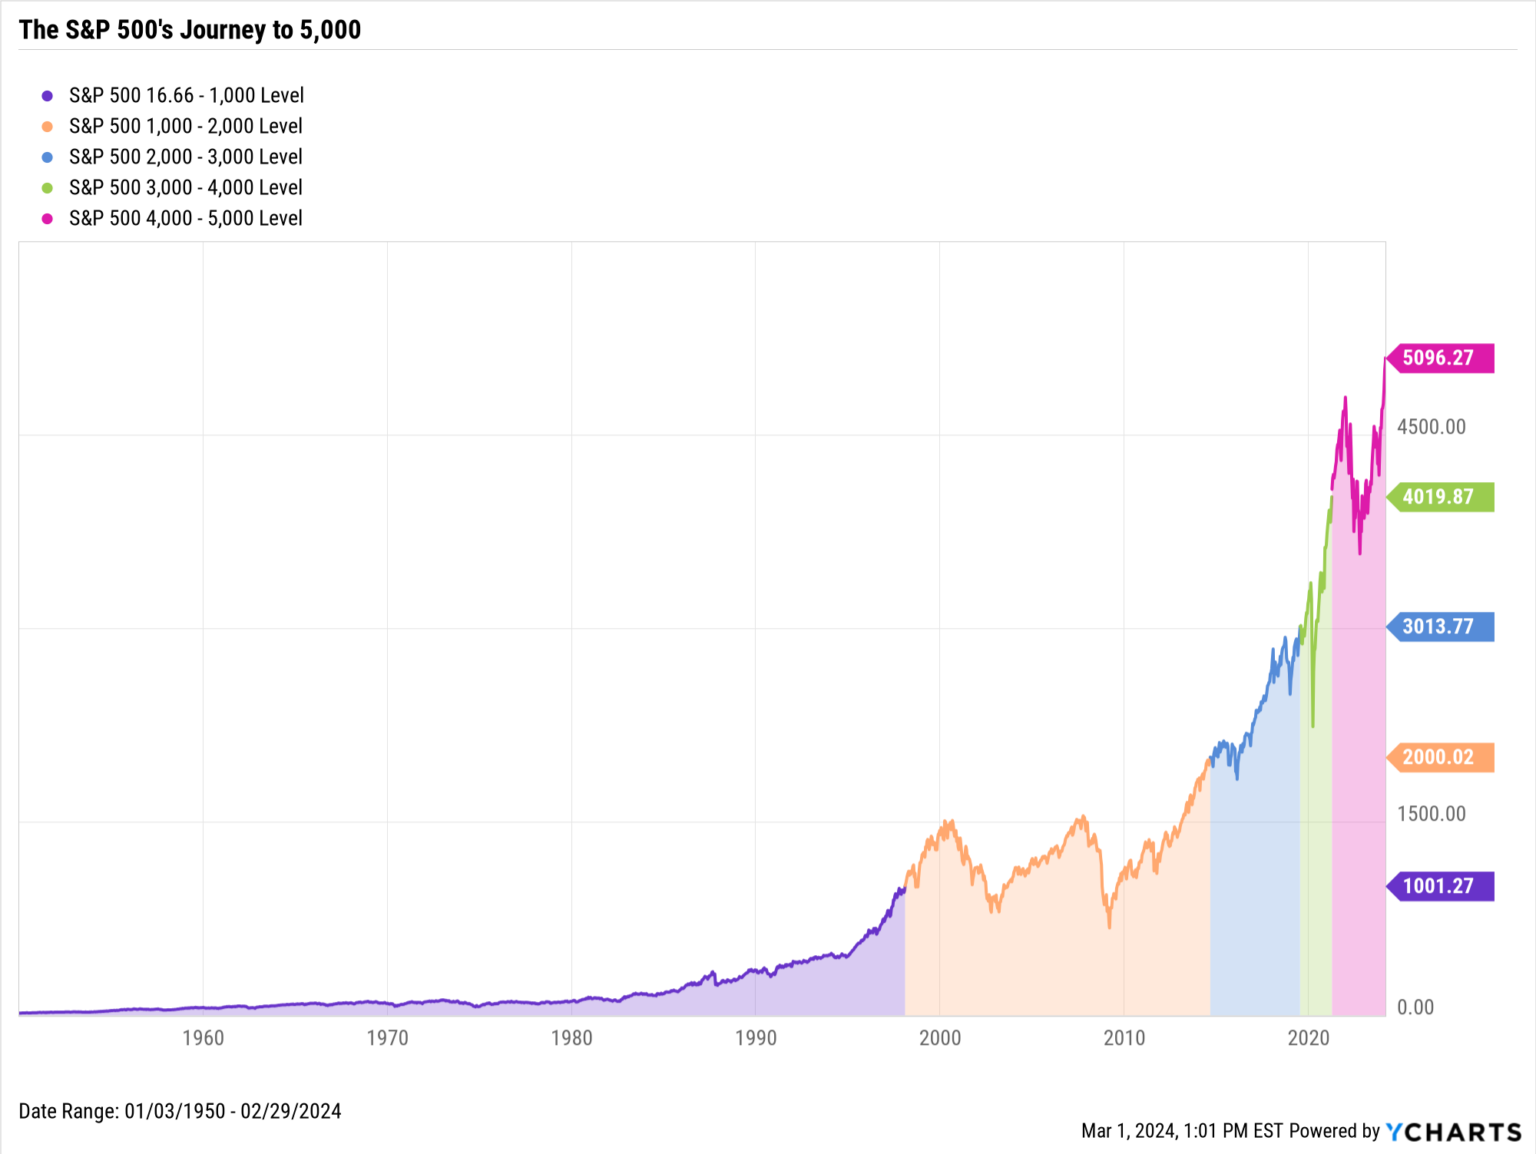
Historically, investing only during the presidencies of one’s preferred political party results in missing out on significant gains over time. For example, a fully-invested all-S&P 500 portfolio generated an 8.11% annualized return since 1950 through October 31st, 2024, much higher than that same portfolio invested only during Democratic or Republican presidencies, and cash otherwise.
Though the candidates, policies, and election results differ every four years, staying the course has produced the best long-term outcomes regardless of who wins or loses.
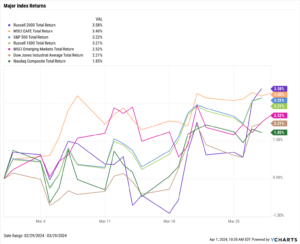
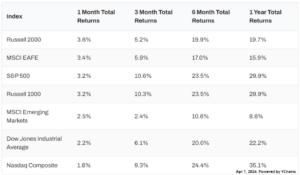
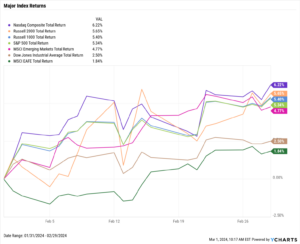
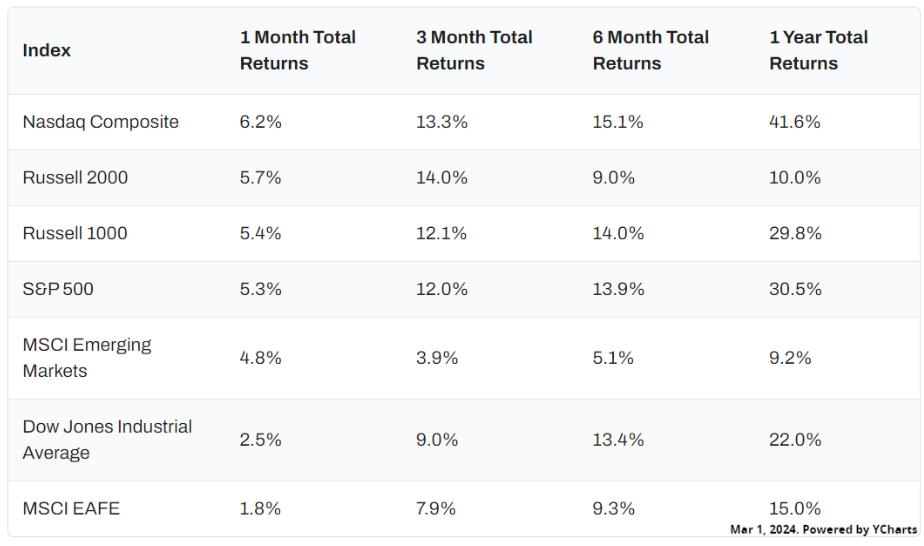
Equity Performance: U.S. Indices Take Breather, Semiconductor Companies Weigh on Tech Sector
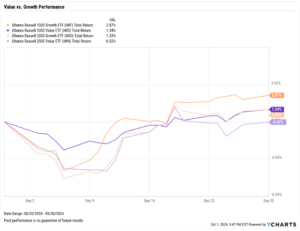
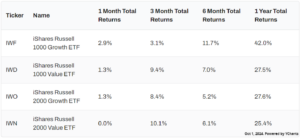
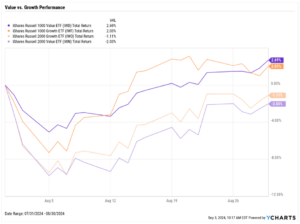
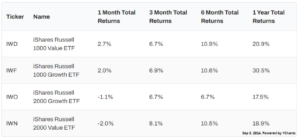
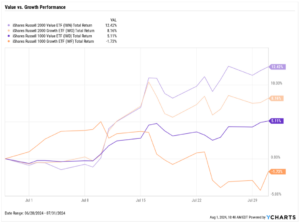
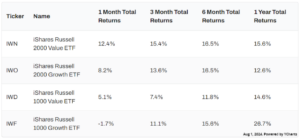
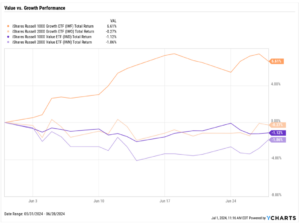
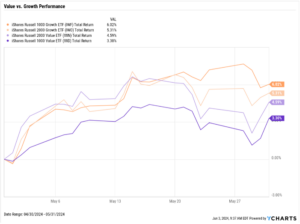
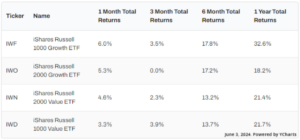
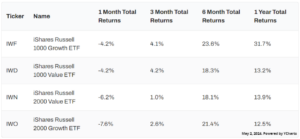
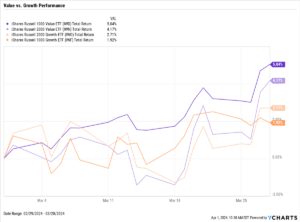
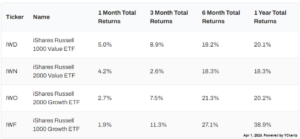
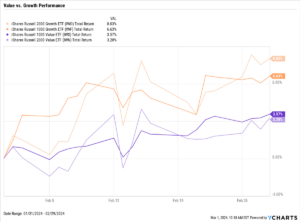
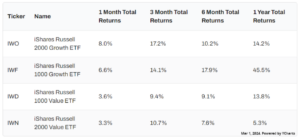
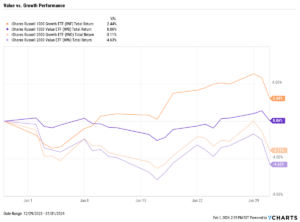
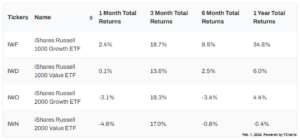
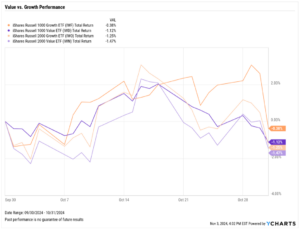
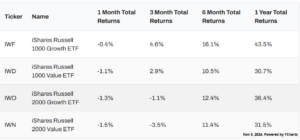
Value vs. Growth Performance
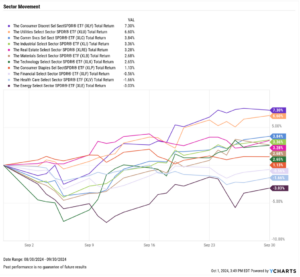
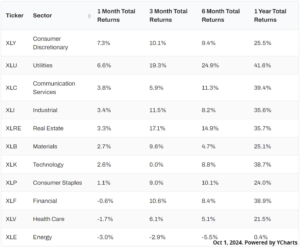
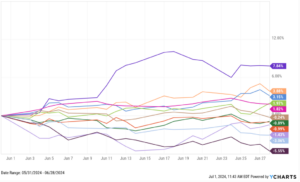
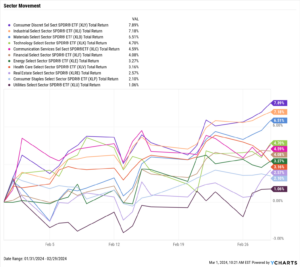
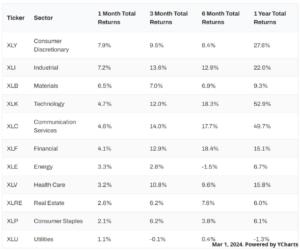
US Sector Movement
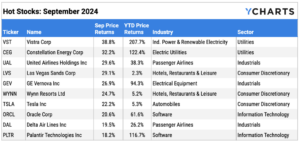
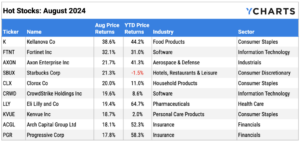
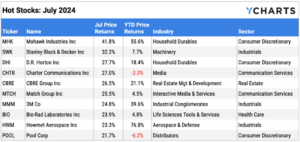
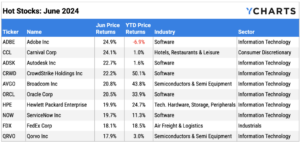
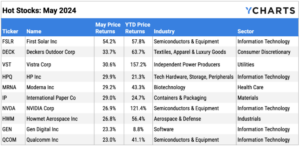
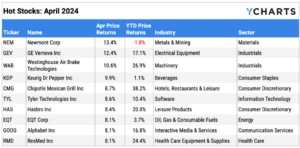
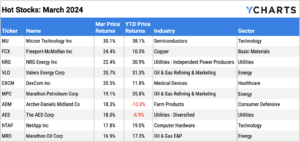
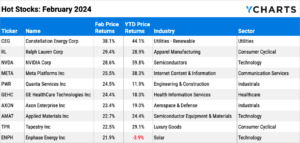
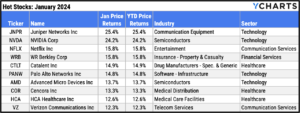
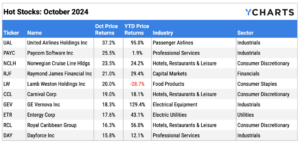
Top 10 S&P 500 Performers of October 2024
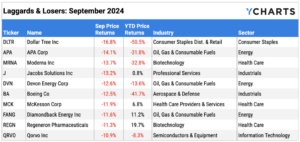
10 Worst S&P 500 Performers of October 2024
Economic Data Overview: Economy Adds Fewest Jobs since December 2020, Gold and Bitcoin Hit Highs
Employment
The unemployment rate remained unchanged at 4.1% between September and October, while the labor force participation rate fell 0.1 percentage points to 62.6%. October nonfarm payroll data showed that the U.S. economy added just 12,000 jobs this month, partially due to the recent hurricanes and dockworker strike. This was the lowest monthly jobs figure since December 2020 and well below the expected increase of 100,000.
Consumers and Inflation
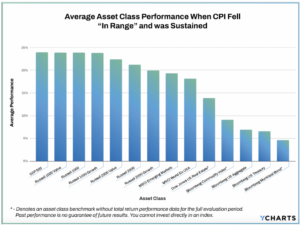
The US inflation rate fell for the sixth straight month to 2.44% in September; on the other hand, core inflation went in the opposite direction for the second month in a row, coming in at 3.31%. The US Consumer Price Index rose 0.53% month over month, and US Personal Spending increased by 0.18%.
The Federal Reserve’s next FOMC meeting is just around the corner on November 7th, where the Fed is expected to cut its key Fed Funds Rate by 25 basis points, according to CME FedWatch. This would lower the Fed Funds Rate down to 4.50%-4.75% from 4.75%-5.00% and mark the second rate cut since March 2020.
Production and Sales
After remaining unchanged at 47.20 between August and September, the US ISM Manufacturing PMI came in at 46.50 in October, slipping another 0.7 points further into contraction territory. However, the Services PMI surged 3.4 points higher to 54.90 in September, building further momentum off of a 2.6-point gain from July. The YoY US Producer Price Index fell to 1.76% in September, while US Retail and Food Services Sales increased 0.43% between August and September.
Housing
US New Single-Family Home Sales rebounded by 4.1% MoM in September following a contraction in August, but Existing Home Sales dipped by 1% MoM. The Median Sales Price of Existing Homes dipped for the third consecutive month to $404,500 as of September. This marks a 2.9% MoM decrease and a 5.2% decline from its all-time high set in June. Mortgage rates surged higher in October, forming a V-shaped recovery since August. The 15-year Mortgage Rate rebounded by 83 basis points to 5.99% while the 30-year rose by 64 bps to 6.72%, both as of October 31st.
Commodities
Gold continued its 2024 run, adding another 4% in October, bringing its price per ounce in US Dollars to $2,734.20 as of October 31st, marking a YTD gain of 31.6%. Crude oil prices dipped slightly in October; the price of WTI fell by 1.6% in October to $67.65 per barrel as of October 28th, while Brent sank by 0.7% to $71.87. Falling oil prices translated into lower gas prices, with the average price of gas shedding another 8 cents MoM to $3.22 per gallon.
Fixed Income Performance: Insights into Bond ETFs & Treasury Yields
US Treasury Yield Curve
Bond Fund Performance